Reducing anesthetic gases in the OR
Hospital Clínica Bíblica, Costa Rica
Case study summary
Anesthetic gases represent 15% of the hospital's overall carbon footprint, thus the importance of reducing their use and finding alternatives to minimize the environmental footprint associated with the process. This case study comprises all of the hospital’s operating rooms, including those at headquarters and the Santa Ana branch.
Demographic information
- City: San José
- State/province/region: San José
- Country: Costa Rica
- Type of institution: private health facility
- Number of full-time staff: 1,075
- Patient population served per year:
- 205,051 outpatients
- 3,927 patients inpatients
- Geographic area served: all the country
- Number of beds: 56

As an anesthesiologist, I think this is a very important project, since it allows us to contribute to the hospital's values through environmentally sound actions, while ensuring the quality and safety standards that distinguish our institution.
The issue
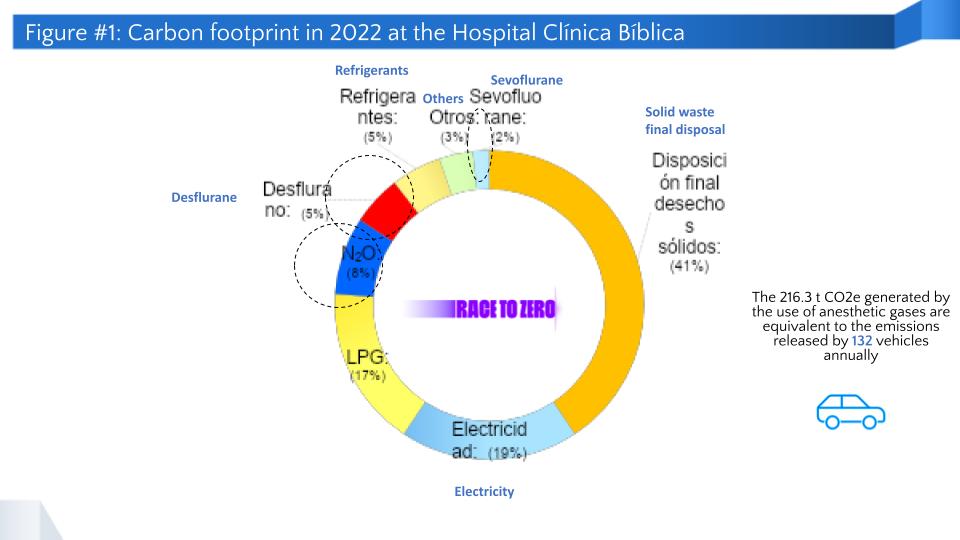
In 2022, the carbon footprint associated with anesthetic gases (sevoflurane, desflurane, and nitrous oxide) was 216.3 t CO2e, representing 15% of that year's overall carbon footprint. This led to considering how to reduce the associated emissions. Moreover, according to the U.S. National Institute for Occupational Safety and Health, exposure to high concentrations of residual anesthetic gases can cause health impacts such as headaches, irritability, fatigue, nausea, and dizziness.
Figure 1 shows the hospital emissions in 2022 and the most important supplies or processes that need to be managed. Actions have already been implemented to address the use of liquified propane gas (LPG) and electricity.
Hospital goals
- To reduce greenhouse gas (GHG) emissions associated with anesthetic gases by 5% (kg CO2e/surgery) during 2023.
- To reduce GHG emissions associated with anesthetic gases by 7% per year from 2024 to 2030, for which residual emissions of 2.1 kg CO2e/surgery have been estimated.
- To promote the use of sevoflurane instead of desflurane and establish the use of low fresh gas flows.
- To promote the use of air instead of nitrous oxide in fresh gas flows.
- To save at least USD 15,000 a year by applying the proposed practices.
- To promote the use of total intravenous anesthesia (TIVA).
Sustainability strategy implemented
The selection of this strategy was based on the environmental, financial, and safety benefits for operating room staff while maintaining quality and safety standards for our patients.
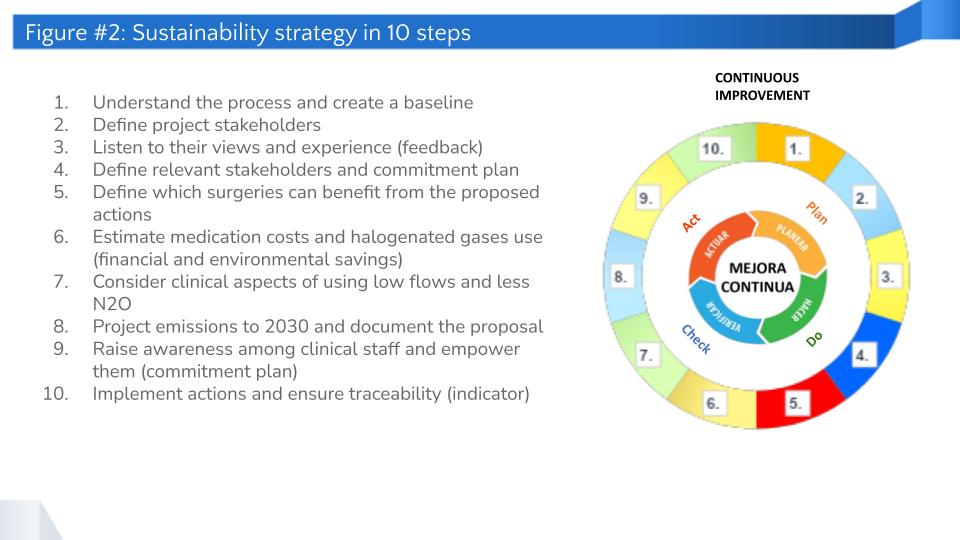
The strategy design comprised the following steps:
- Understand the anesthesia administration process and the supplies used and create a baseline through carbon footprint measurement.
- Consider the views and experiences of project stakeholders, such as the anesthesiology department, nursing staff, hospital environmental area, and anesthesia machine maintenance service supplier, among others.
- Define stakeholders’ relevance and commitment to the plan, considering their level of power and interest in the project, in order to allocate resources accordingly.
- Define what surgeries can apply the proposed actions (such as when to use TIVA, regional block, sevoflurane and desflurane) in order to specifically allocate resources.
- Estimate costs as a point of reference for the previous step and available alternatives.
- Consider the clinical aspects of using low flows and less N2O based on scientific reference and the input of experienced medical staff.
- Project emissions to 2030 considering business growth, the resulting increase of emissions, and anticipated reductions from actions implemented.
- Raise awareness among clinical staff and empower them through talks, discussion forums, conversations, gatherings, and other related activities.
- Implement actions and track the kg CO2 e/surgery indicator in order to check if goals are being achieved or if adjustments are needed.
- Monitor and follow-up implemented actions by means of a continuous improvement cycle.
Implementation process
Specific actions of the implementation process are described below.
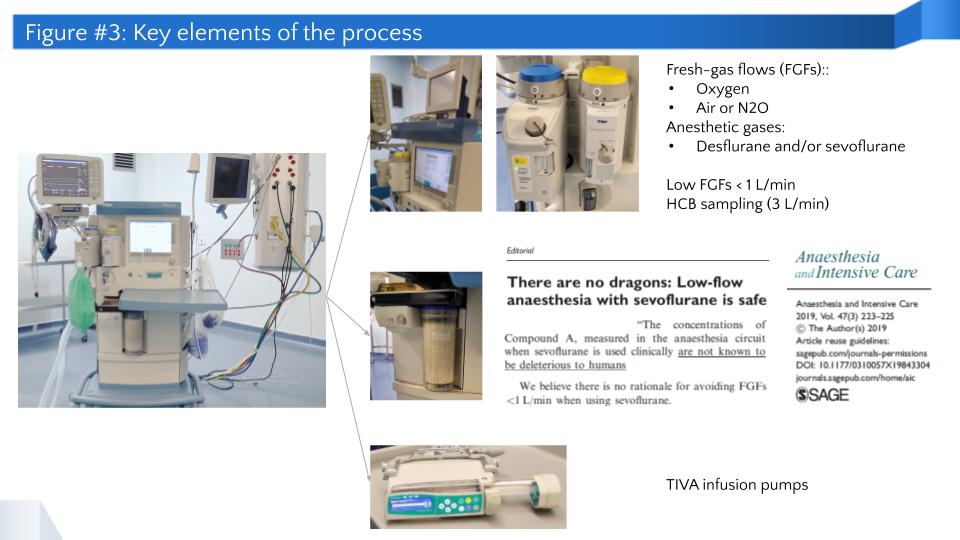
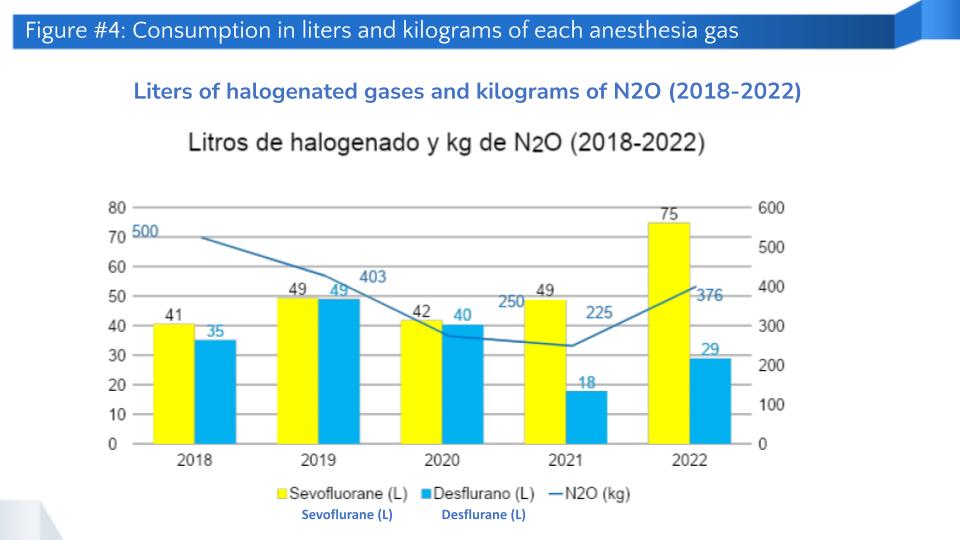
- Clear understanding of process, supplies, and baseline: The hospital uses sevoflurane, desflurane, and nitrous oxide as anesthetic gases, the last of which is more focused on fresh gas flows and, along with oxygen, transports halogenated gases in anesthesia processes. Nitrous oxide can be replaced with air, an increasingly common practice. One of the proposed actions for fresh gas flow is to use flows lower than 1 L/min, which has been demonstrated to be safe (Sage Journals, 2019). Another alternative is total intravenous anesthesia, which achieves similar goals through medication. Establishing a baseline is crucial for calculating the carbon footprint and defining goals. The following chart shows the amount of sevoflurane, desflurane, and nitrous oxide used during the last five years, revealing a reduction up to 2021, although the increase in the number of surgeries and their complexity suggests an upturn.
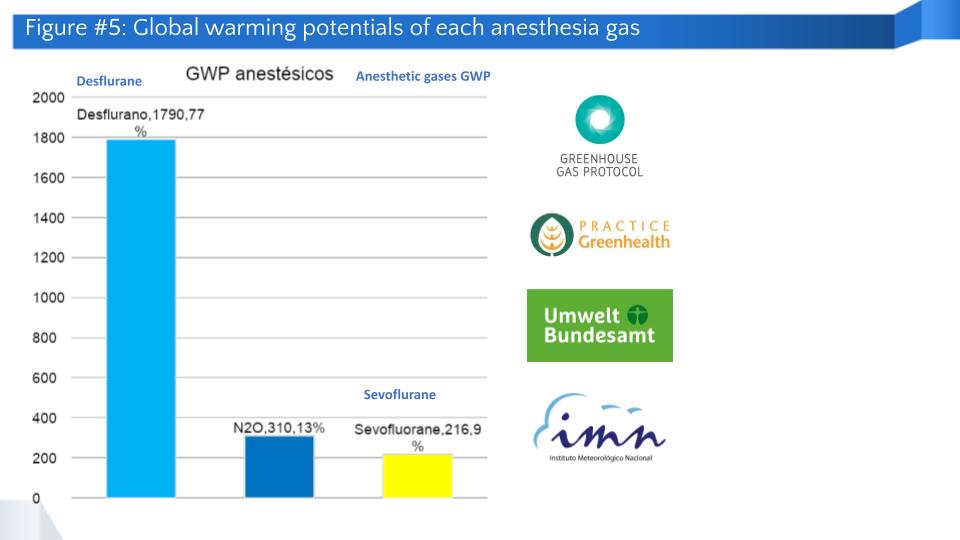
- Global warming potentials: The following figure shows the global warming potential (GWP) of the three anesthetic gases used in surgery. Desflurane is a gas with a higher GWP.
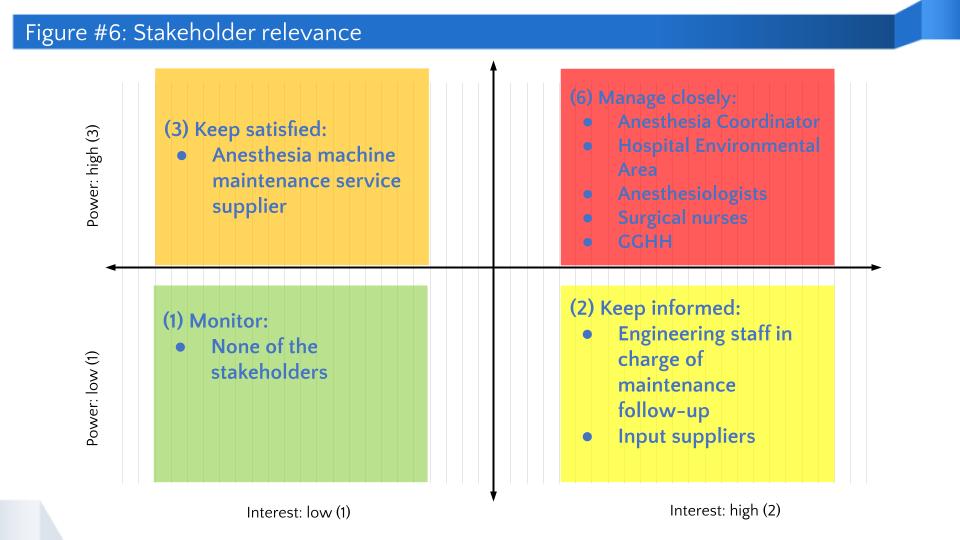
- Identification of relevant stakeholders and commitment plan: Stakeholders are key to the project. The methodology of this initiative assesses stakeholders’ relevance using two indicators: power and interest. Thus, a commitment plan is defined and prioritized. The following figure shows this in detail.
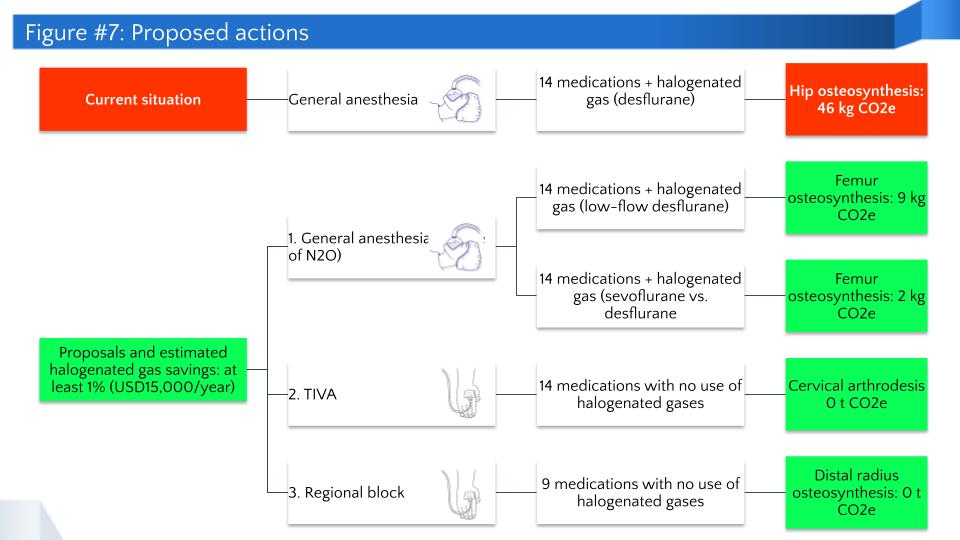
- Options to implement: Figure 7 shows the different options considered, including the number of medications and applicable options in each case, as well as the associated carbon footprint. The estimated annual savings of USD 15,000 are based on the total amount of medications and anesthetic gases used for the different options.
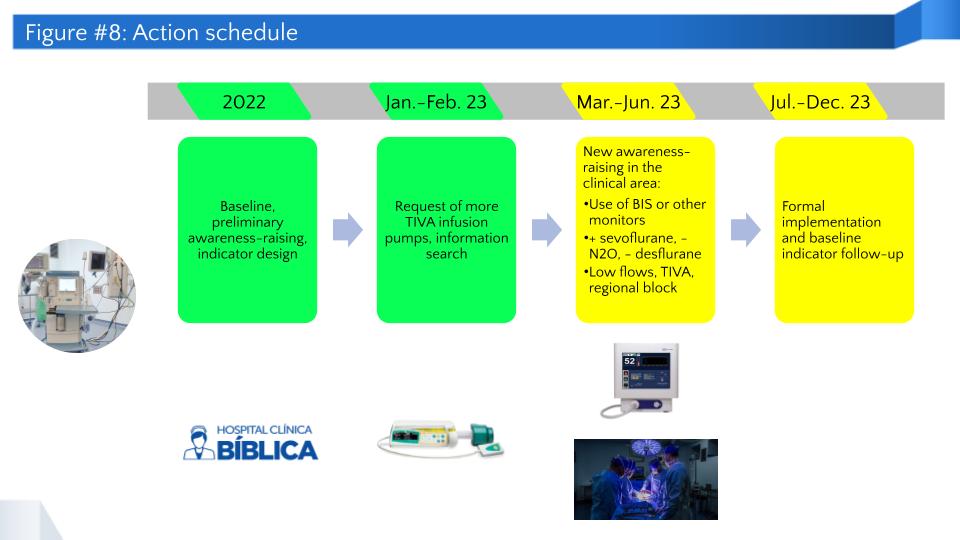
- Work timeline: Figure 8 shows the timeline that has been adopted for project development and is intended to be continued in 2023. It is our goal to sustain the different actions throughout 2024-2030.
Tracking progress
The process is evaluated by measuring the carbon footprint and the kg CO2e/surgery indicator through the following activities:
- Quarterly verification of the carbon footprint associated with the use of anesthetic gases.
- Regular communication with staff to keep them informed about the state of anesthetic gas use and carbon footprint.
- Implementation of the annual mitigation plan, which integrates aspects such as the current state of the action, classification of associated GHGs, follow-up indicators, link with Costa Rica's NDC, outcome by the end of the year, and improvement opportunities for the following year.
Progress achieved
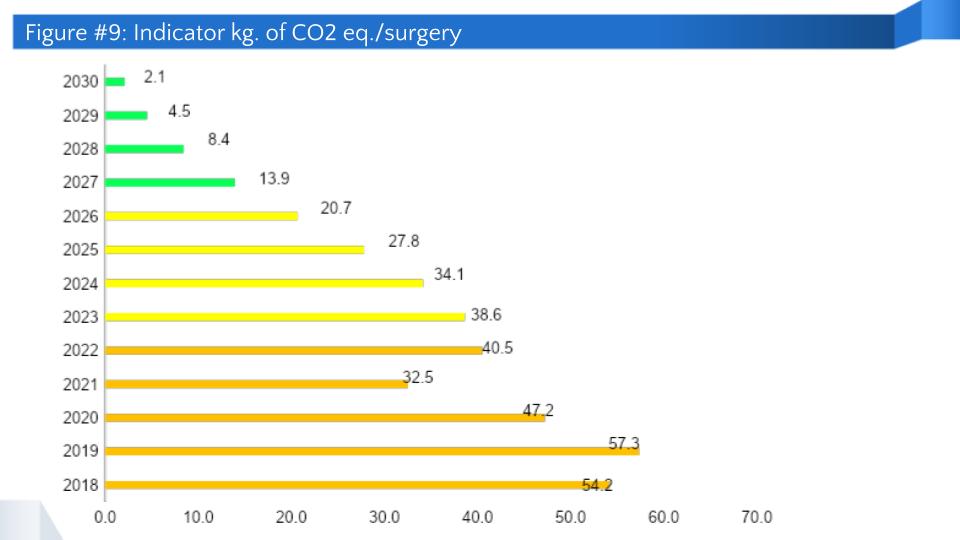
Figure 9 shows the carbon footprint in kg CO2e/surgery from 2018 to 2022, and a projection to 2030 that considers the implementation of the proposed actions. The increase during 2022 is due to the higher complexity of the surgical procedures performed. This suggests the need to add another indicator to assess project additionality in a more specific manner, such as g CO2e/min of surgery. However, in order to tabulate this information, massive data from anesthesia machines are needed, which is a limiting factor at the moment.
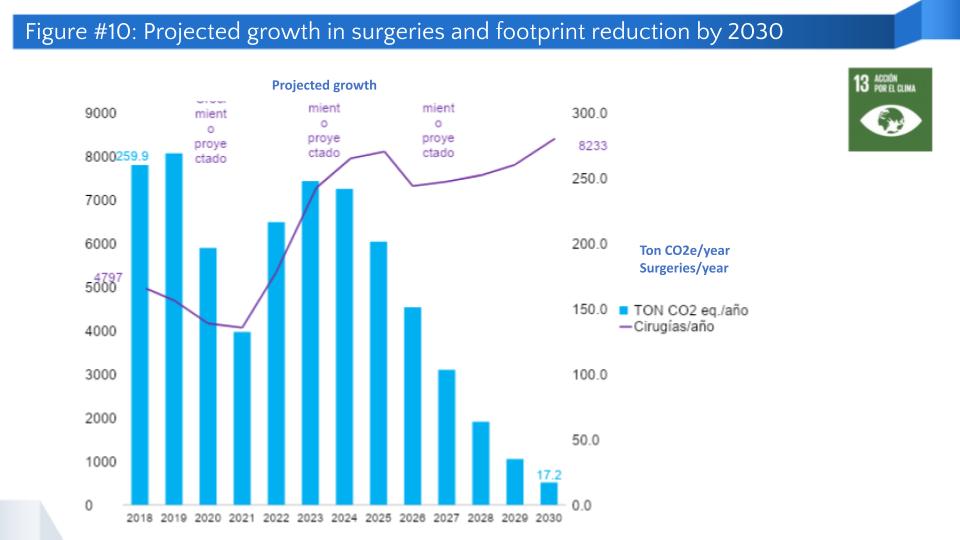
The following figure shows the number of surgeries and the carbon footprint associated with the use of anesthetic gases up to 2022. From 2023 onwards, a projection to 2030 is shown that considers the same activities as described above.
This process has additional financial and social benefits through savings from anesthetic gas reduction and less clinical staff exposure in ORs, maintaining quality and safety standards for patients and staff.
Challenges
- Cultural change in clinical staff to adopt the use of new practices.
- Use of resources (TIVA pumps).
- Detailed breakdown of supplies used in anesthesia procedures.
- Clinical staff’s lack of knowledge about the carbon footprint associated with anesthetic gases.
- Increase in the complexity of surgical procedures performed, which increases the use of anesthesia.
- Limited access to the information stored in anesthesia towers.
In order to reduce the carbon footprint associated with the use of anesthetic gases it is crucial to involve health professionals, which certainly facilitates understanding and applying the alternatives available. We are considering different spokespersons to positively get the message across to each health professional by means of a customized approach.
Lessons learned
- Availability of high-quality equipment that can be used in the hospital.
- Importance of equipment to assess the depth of anesthesia, as well as monitors and TIVA infusion pumps.
- Safety of using low flows.
- Rotation and use of N2O cylinders to maximize their use.
- Projections to 2030 assist with visualizing medium and long-term goals and the efforts needed.
- The success of the strategy depends on the clinical staff's commitment and management support.
- The appointment of spokespersons from the anesthesiology department helps get the anesthetic team on board.
- Training and awareness-raising have incorporated basic concepts regarding the GWP of anesthetic gases, as well as clinical concepts related to the use of low fresh gas flows.
- The hospital is planning to acquire more TIVA infusion pumps, but purchasing must be assessed against the equipment's actual use.
Next steps
- Customized awareness-raising for each anesthesiologist to explain the project in detail.
- Implementation follow-up based on the kg CO2e/surgery indicator.
- Discourage the use of desflurane (only for special cases) and N2O.
- Identification of a supplementary indicator to ensure better traceability of implemented actions. The g CO2e/min of surgery indicator is proposed.