Baselining emissions to enhance decarbonization
Mercy Health, Australia
Case study summary
Mercy Health has worked to establish the organization’s full carbon emission baseline across health and aged care divisions including Scope 3 (indirect) emissions. This carbon inventory work has identified Mercy Health’s top carbon hot spots, allowing targeted interventions to address climate change at organizational, divisional, and site levels.
Demographic information
- City: Melbourne, Australia (corporate office)
- State/province/region: Victoria
- Country: Australia
- Type of institution: Provides health and aged care
- Number of staff: 10,000+
- Patient population served annually
- Number of patients served annually (total of inpatient and outpatient):
- 64,000 emergency department presentations
- 60,000 inpatient admissions
- 333,000 outpatients
- Geographic area served: Mercy Health has facilities in four states in Australia (New South Wales, Queensland, Victoria, and Western Australia).
- Number of patients served annually (total of inpatient and outpatient):
- Number of beds: Around 820 health service points and care and 2,400 aged care places.
The issue
In 2020, Mercy Health developed an ambitious strategy in response to Pope Francis’ 2015 encyclical Laudato Si’. The Caring for People and Planet (CPP) strategy summarizes why and how Mercy Health, as a Catholic provider of health and aged care, must act and how it can improve care and outcomes and protect the world’s limited resources now and in the future.
Hospital goal
To determine the entire carbon footprint of the organization, including emissions related to Scope 3 and the supply chain.

The Caring for People and Planet strategy is our organization’s best effort to address climate change and the associated global justice and sustainability challenges in such a way that honors a deep history of integrated ecology as articulated through Pope Francis’ current reflections and thinking in his encyclical Laudato Si’. Our Carbon Inventory project is an important component of our strategic intent to address our carbon footprint, guided by evidence.
Sustainability strategy implemented
The CPP strategy is a comprehensive pathway to guide Mercy Health toward net zero. As a part of implementation, an organization-wide carbon inventory project analyzed Scope 1, 2, and 3 emissions to determine the organization’s full carbon footprint. A business case was developed, and internal funding was allocated to conduct a carbon footprint study. A consulting firm with health service carbon accounting expertise (ARUP) was selected to provide carbon accounting expertise, rigor, and objectivity to the work. Mercy Health’s CPP team provided internal support and coordination with other key internal stakeholders to execute the project.
A hybrid top-down (input-output) / bottom-up approach was devised, with reference to the Greenhouse Gas Protocol (2001), and Climate Active carbon-neutral standard for Australian organizations (Climate Active, 2015). Carbon categories were modeled from those described in “Health care’s response to climate change: a carbon footprint assessment of the NHS in England.”
Implementation process
The carbon inventory project commenced with a workshop to confirm the boundary of the study (all Mercy Health) and identify subject matter experts to facilitate data collection. Assumptions were vetted throughout the project by operational area leaders and a mechanism that assisted in sharing project updates across the organization.
The project utilized the four main categories devised by the National Health Service (NHS) to organize data related to carbon footprinting, namely delivery of care, supply chain, commissioned services, and personal travel. Data was collected for 17 sub-categories including supply chain, pharmaceuticals and chemicals, medical equipment, business services, other procurement, food and catering, and non-medical equipment.
The group manager of CPP collected Mercy Health’s top-down economic data and other bottom-up data. Where possible, data was disaggregated by key Mercy Health portfolio groupings (health services, aged care, support services), and then granular business units. The data was forwarded to ARUP consultants for collation and application of emission factors. The project involved collaboration to ensure congruence of understandings about the data, potential gaps, and associated emissions. An interactive data platform was created to allow the data to be utilized for different audiences and applications.
Tracking progress
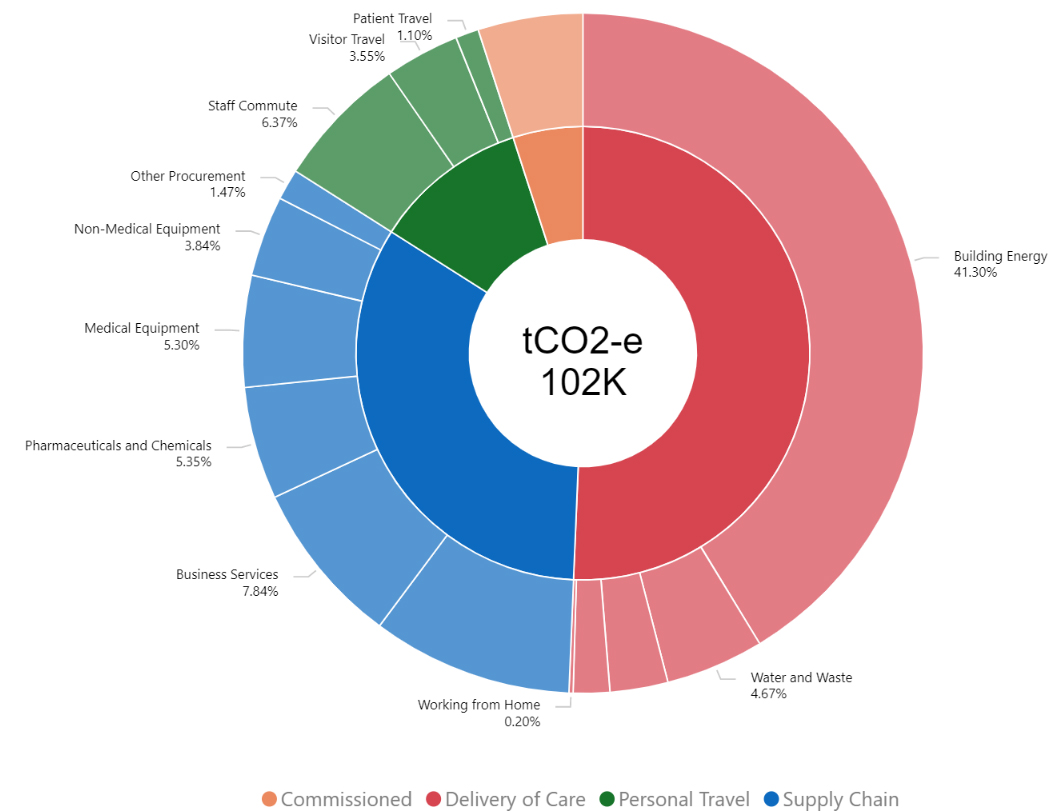
The key deliverable from this project was a detailed account of Mercy Health’s carbon emissions. In 2020-21 (base year) emissions totalled 102,910 tons of carbon dioxide equivalent. Fifty-one percent of Mercy Health’s footprint came from delivery of care, supply chain (33%), personnel travel (11%), and commissioned care services (5%). Scope 1 emissions comprised 8% of Mercy Health’s total carbon footprint, followed by Scope 2 at 30% and Scope 3 at 62%.
The top carbon producers were building energy (41%), food and catering (10%), business services (8%), staff commutes (6%), and pharmaceuticals and chemicals (5%). Health services comprised 49% of Mercy Health’s emissions followed by aged care (48%) and support services (3%).
The results were presented to Mercy Health’s board and executive directors to ensure the highest-level support for the changes, as evidenced by the project. By collecting and analyzing data at a granular level, the carbon footprint of each business unit/site can be shared with local green teams.
Progress achieved
The carbon inventory study has permitted a deep dive into emissions incurred at the organizational, divisional, and facility/business unit levels. The outcomes of the project have recently been assessed against the Global Road Map for Health Care Decarbonization (Health Care Without Harm & ARUP), which identified seven high-impact actions to assist in pursuing net zero. The potential benefit of implementing these actions can now be quantified, for example:
- Power health care with 100% clean, renewable electricity. By moving to renewable sources, Mercy Health can reduce emissions by 33%.
- Transition to zero-emissions sustainable travel and transport. Sustainable travel options offer emissions reduction opportunities of up to 13%.
- Provide healthy, sustainably grown food. Reducing emissions associated with food could result in emissions reduction of up to 10%.
The study will be repeated in order to track progress over time.
Challenges and lessons learned
Challenges experienced in this project included the large amount of data collected from various sources. There were some challenges in validating that the data collected in some domains was comprehensive and accurate, such as waste. Various assumptions were made regarding travel, in lieu of detailed information related to staff, patient, resident, and visitor travel. When repeating the carbon footprint analysis in future years, travel surveys will be required. Mercy Health’s 2022 carbon inventory explored finances in detail from 2020-21, when long and vigorous COVID-19 lockdowns may have had an impact on results (for example visitor travel).

Mercy Health’s Carbon Inventory Project is important work; the first of its kind in Australia across Health and Aged Care. It has demonstrated the importance of context in assessing emissions; highlighting key hot spots for our organization, and the intensity of emissions in particular areas, such as building energy, travel, and food.
Next steps
This carbon inventory project has provided detailed information to allow Mercy Health to target initiatives that will assist in rapid decarbonization. The study highlighted that building energy at Mercy Health requires urgent attention. This study has indicated the importance of carbon footprinting for health and aged care services that are seeking to apply an evidence-based lens to carbon reduction strategies. It is anticipated that this work, the first of its kind in Australia across health and aged care, will be published.