Graphics
Download or share graphics from the Road Map.
Health Care Without Harm and Arup’s Global Road Map for health care decarbonization.

Health care sector emissions reductions between 2014 and 2050 resulting from seven high-impact actions.
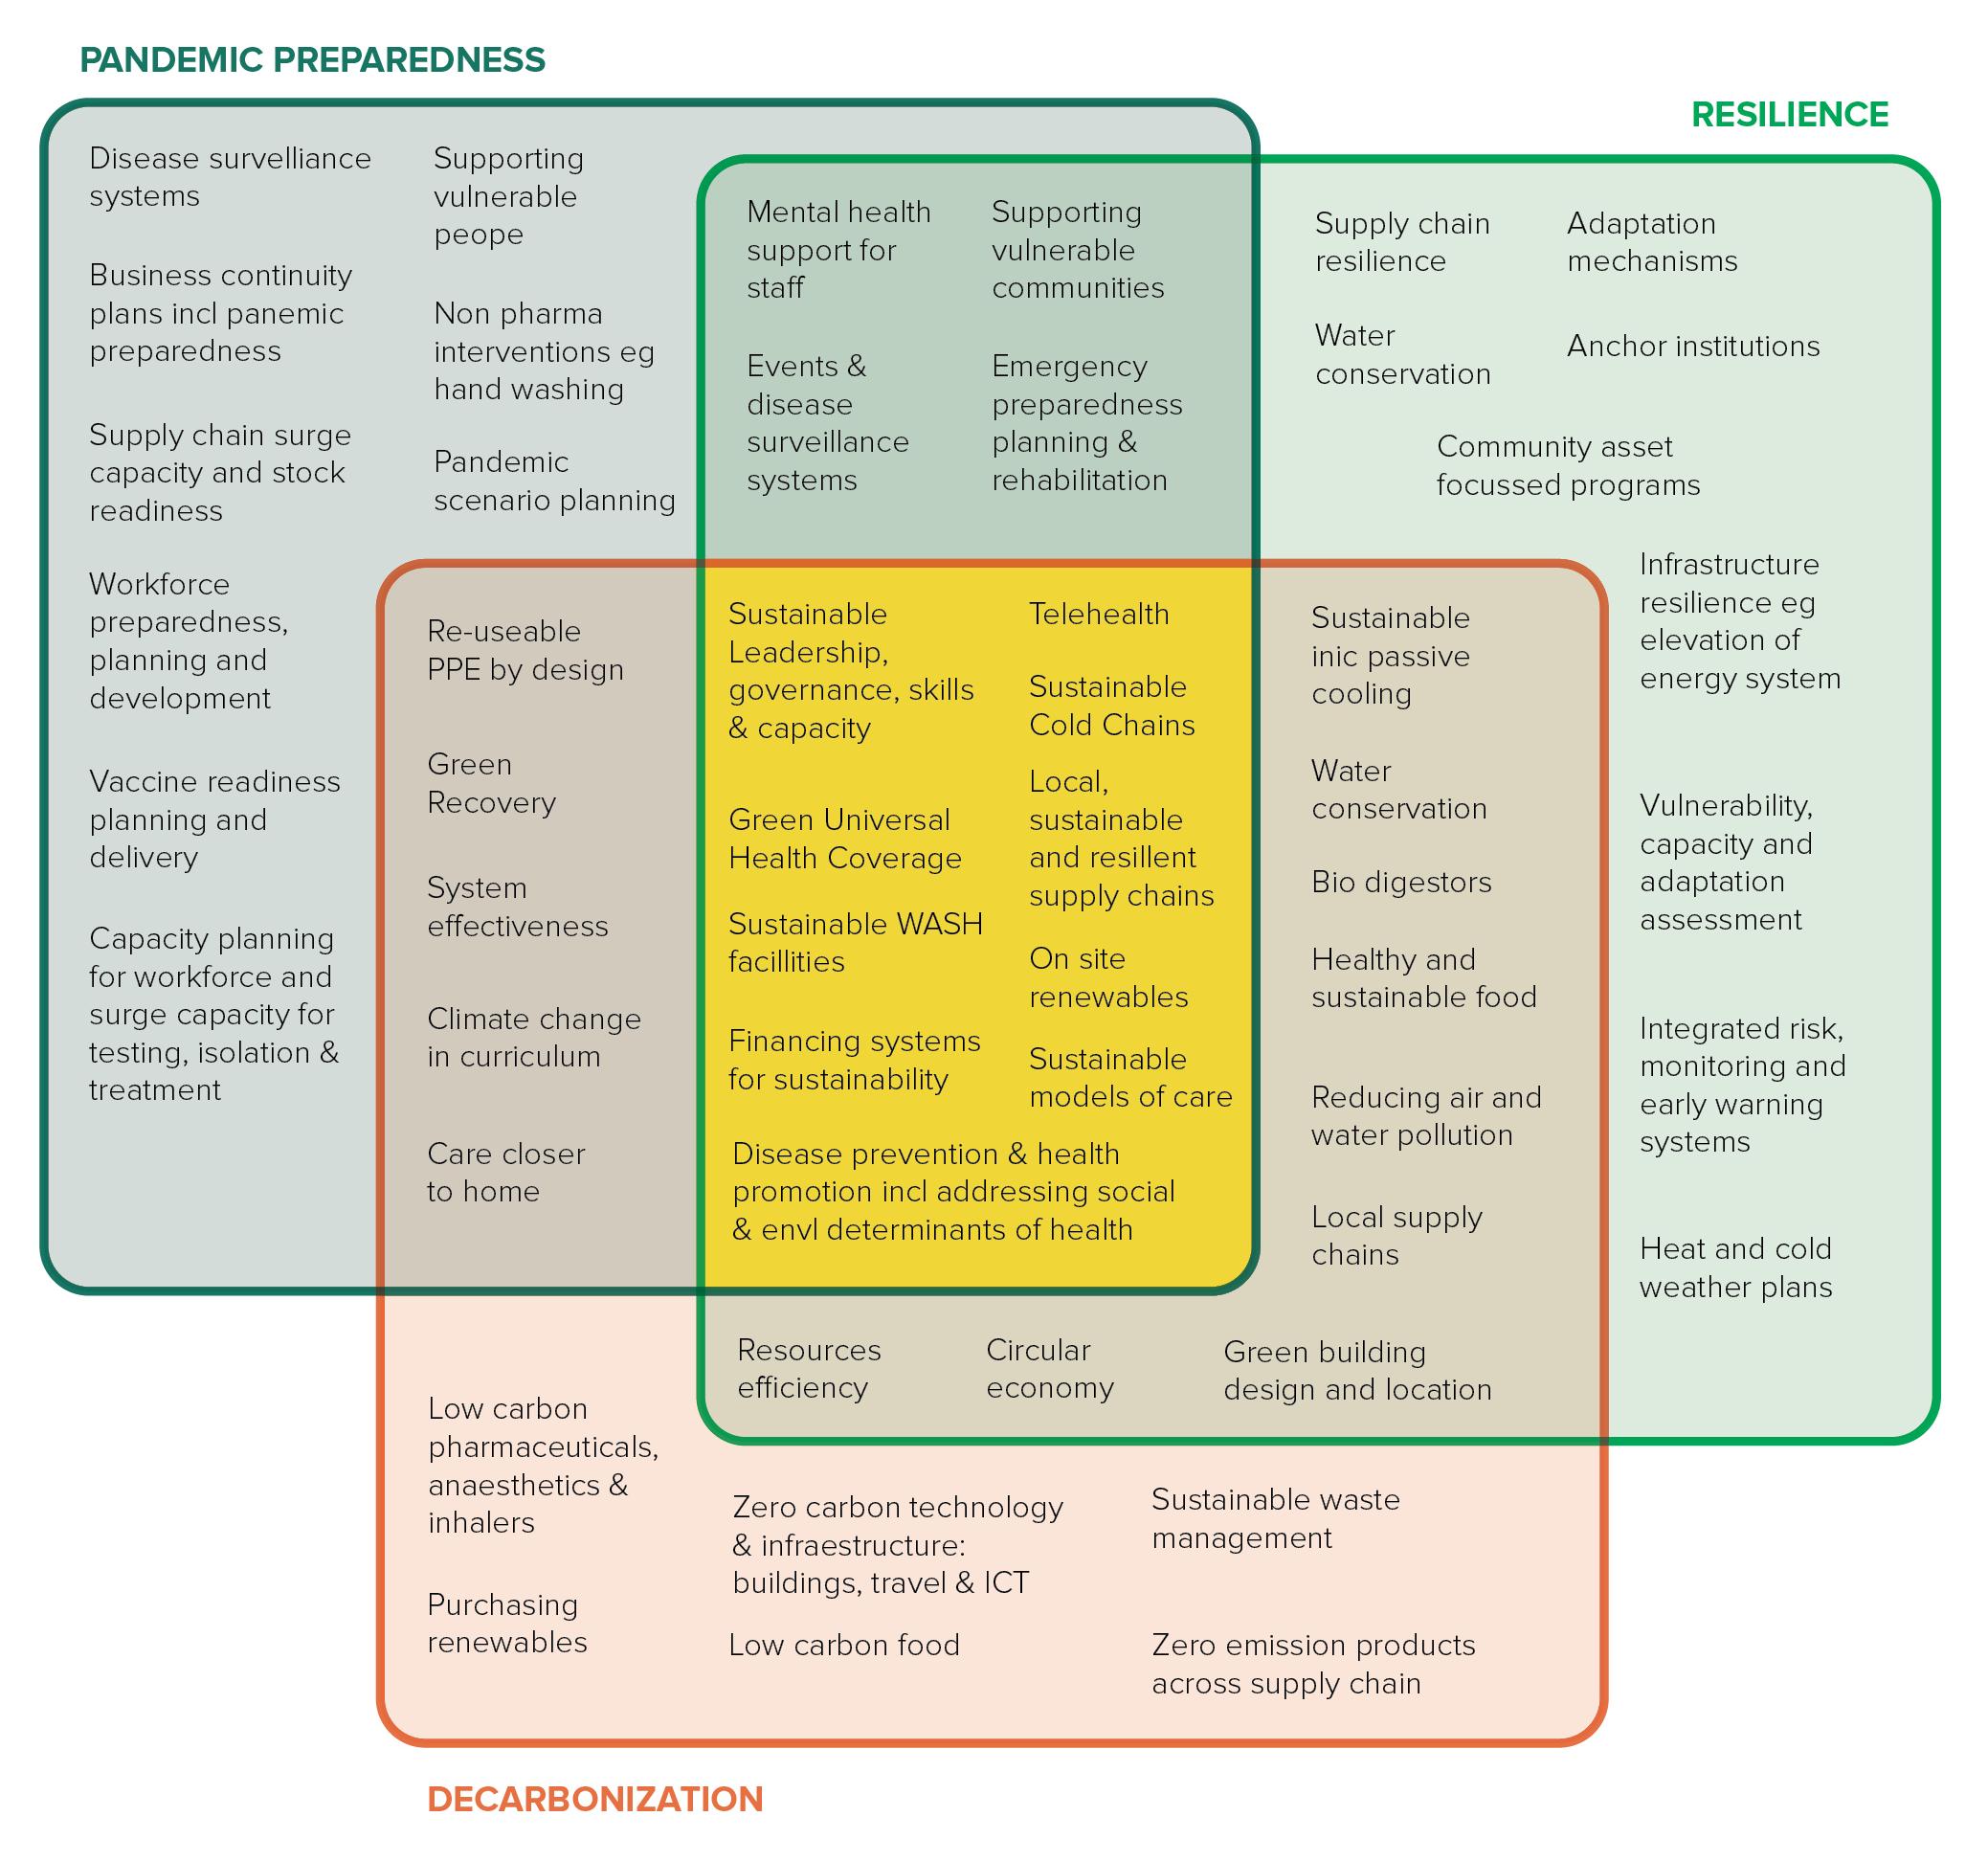
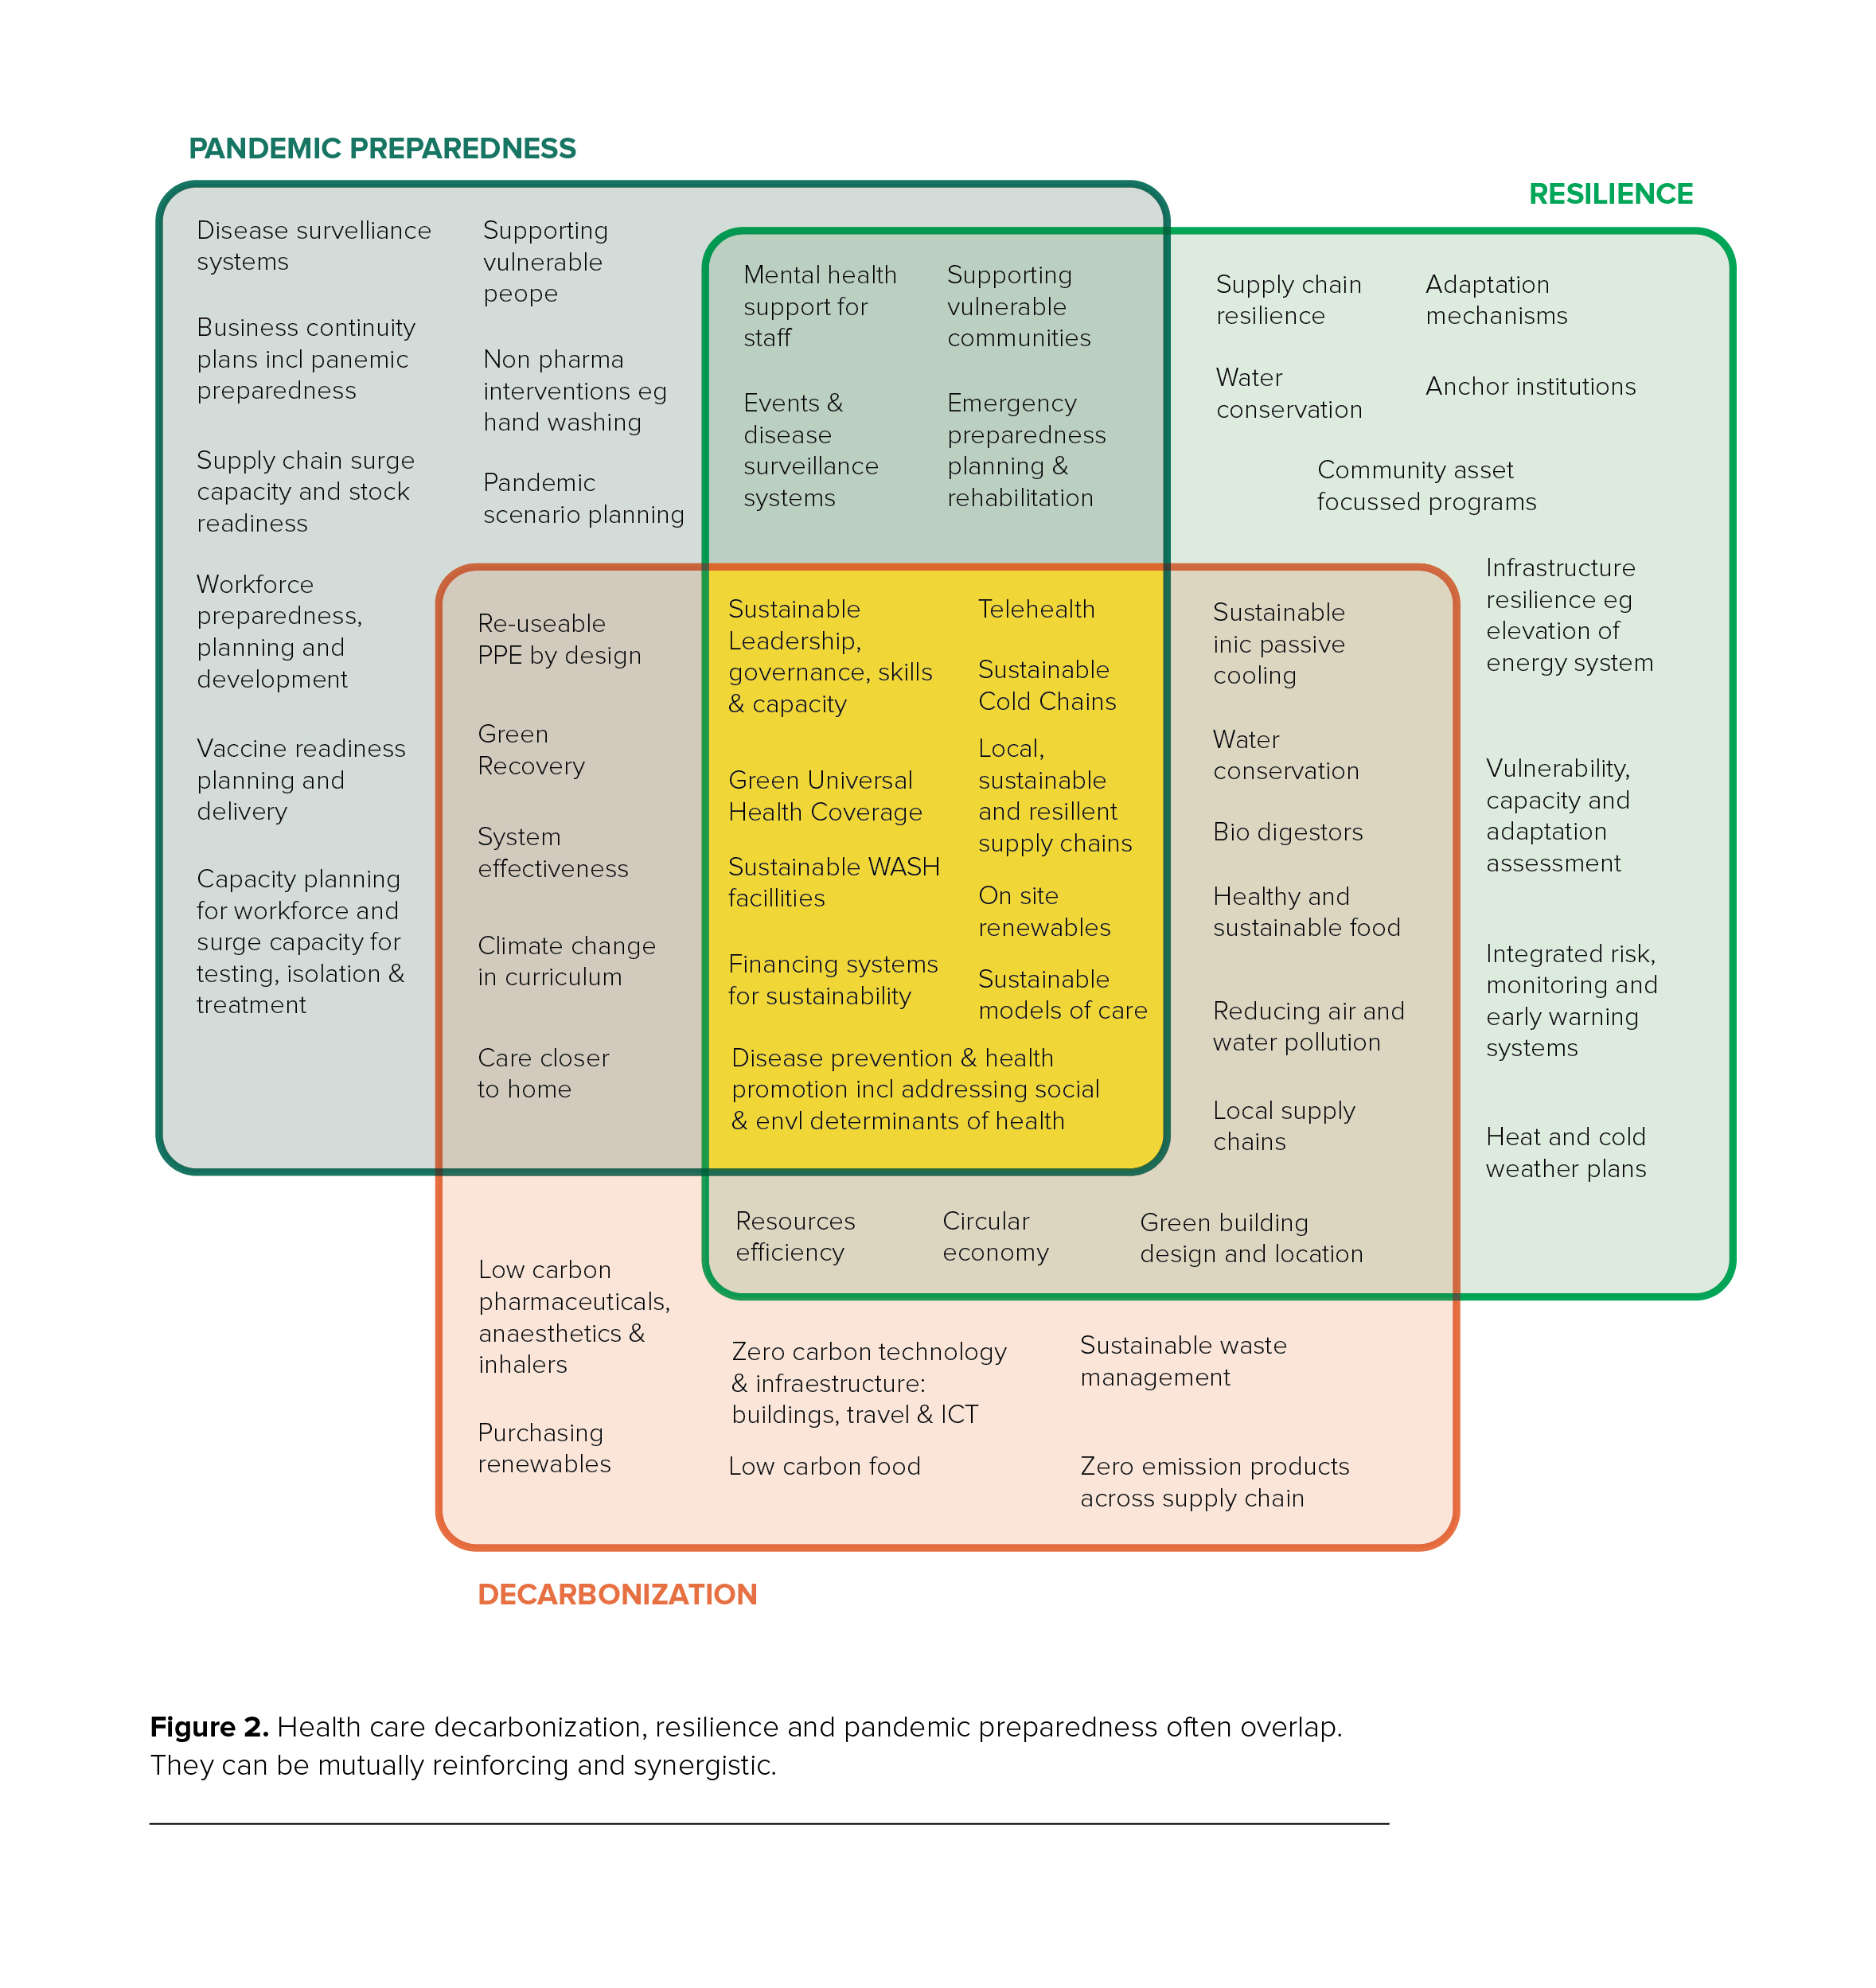
How health care decarbonization, resilience and pandemic preparedness are mutually reinforcing and synergistic.
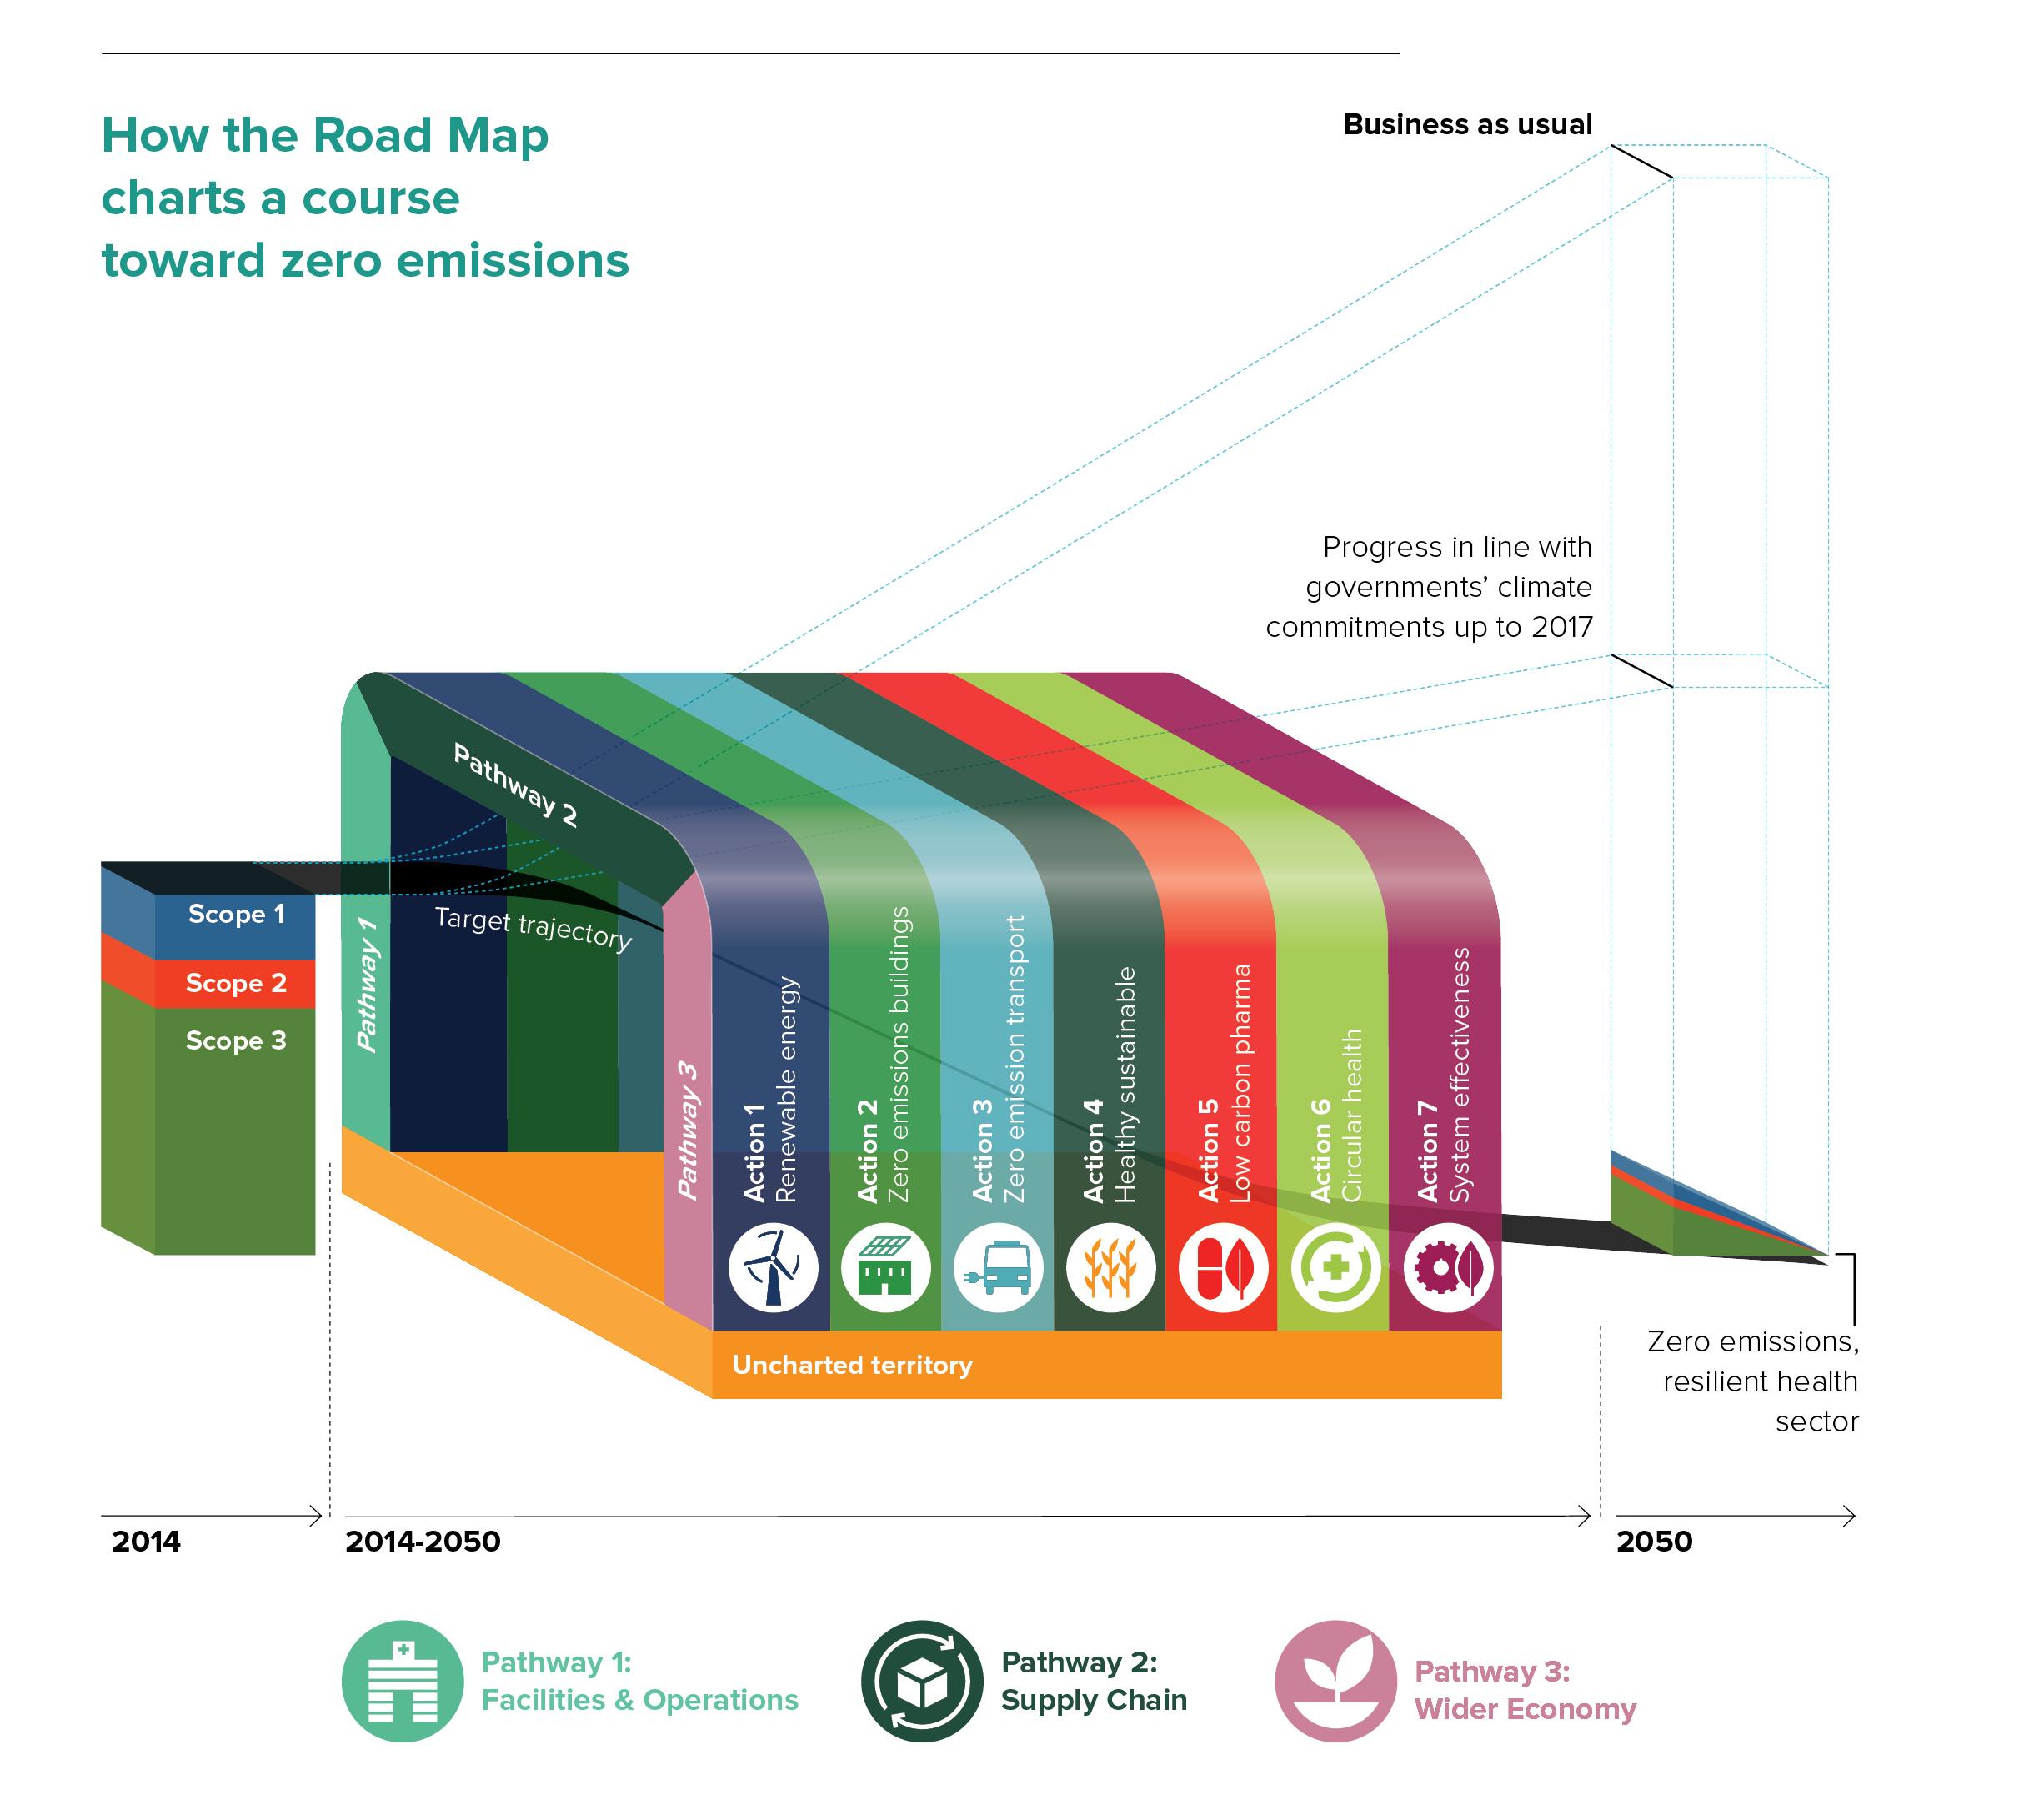
How the Road Map charts a course toward zero emissions.
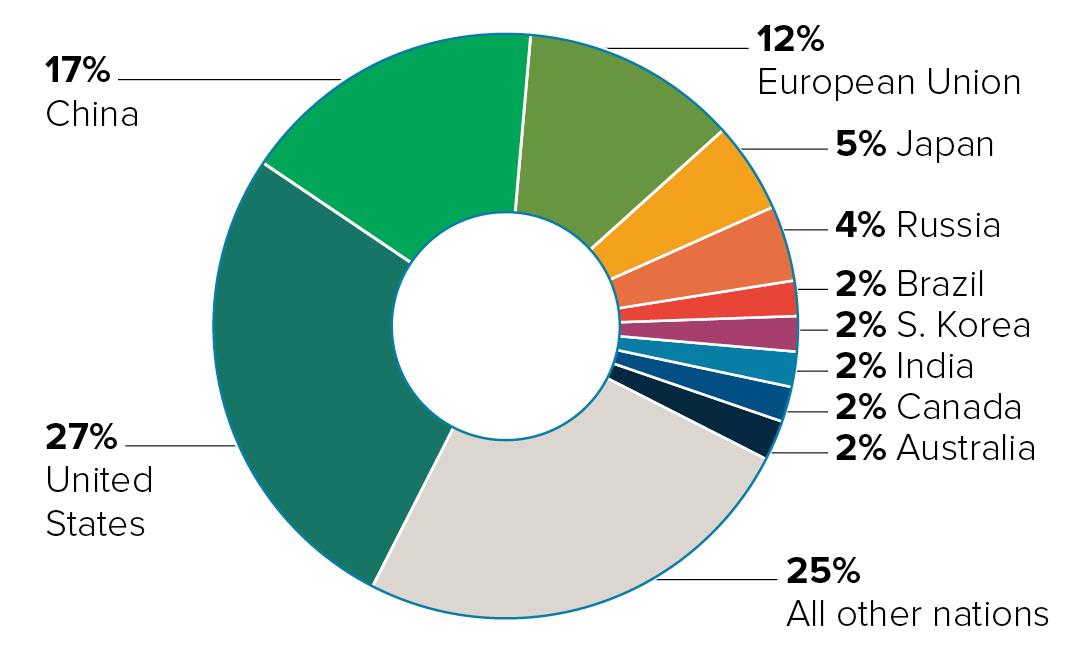
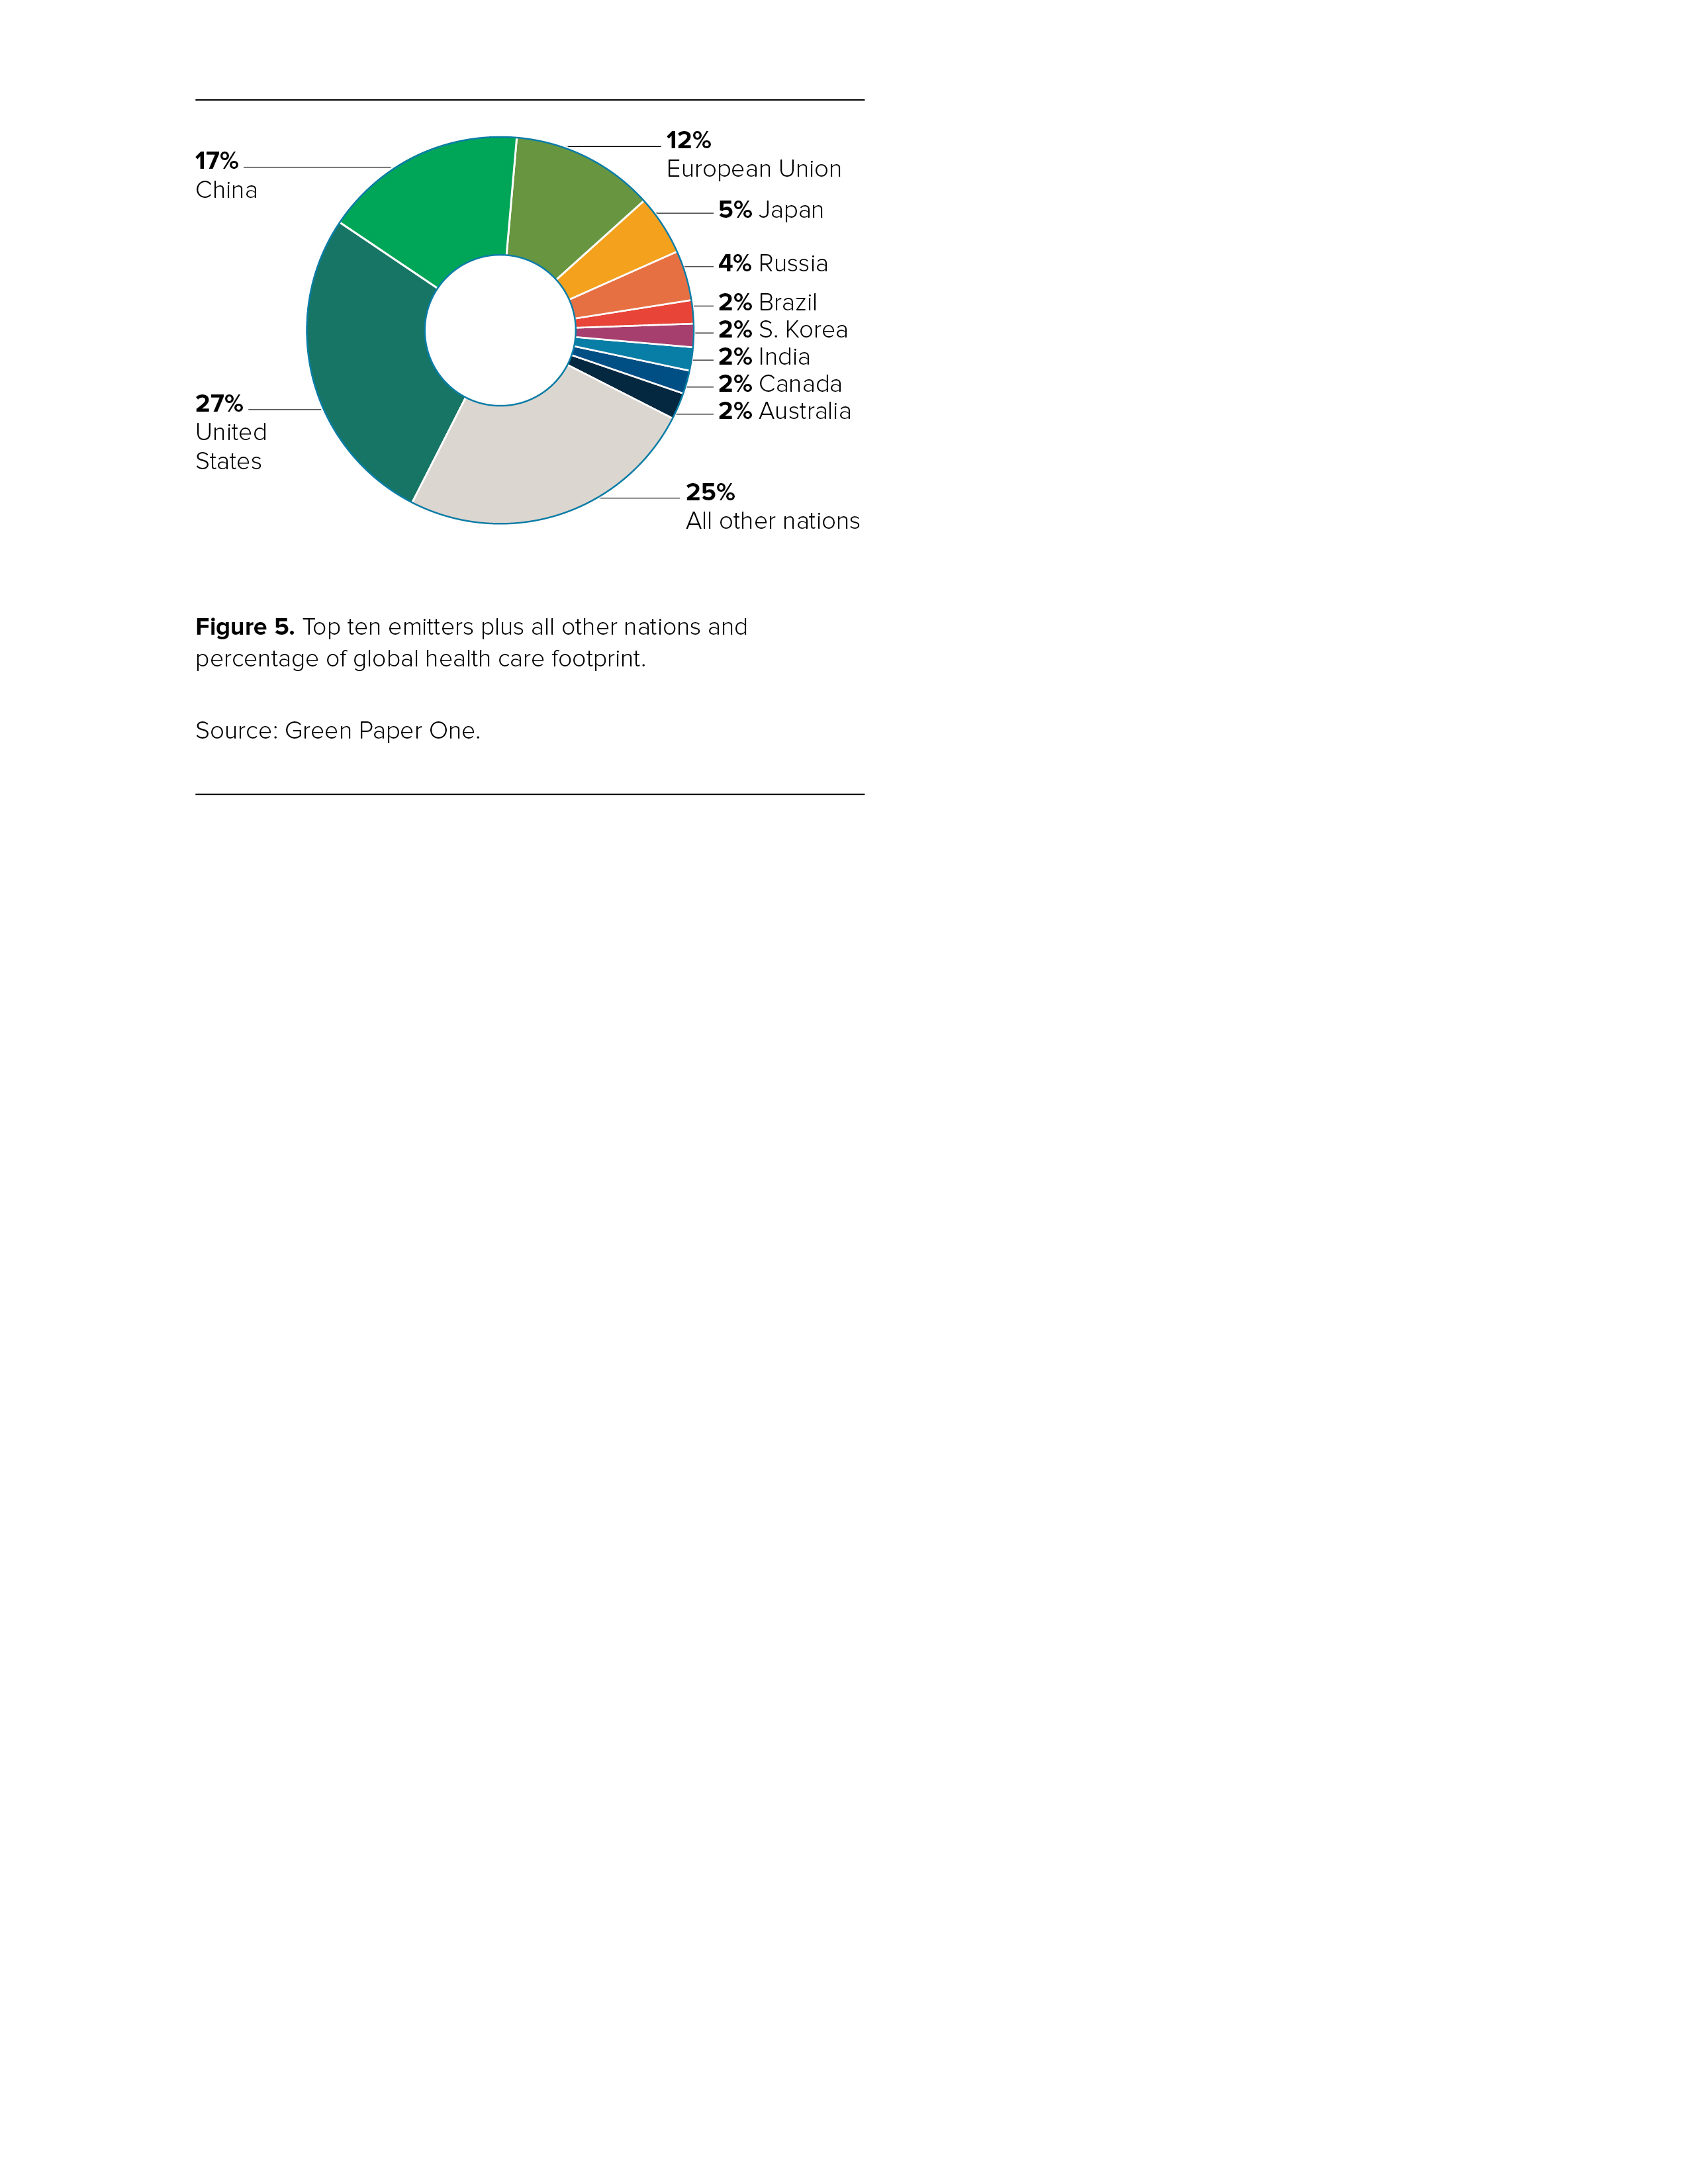
Top ten health care emitters by country ranked by global health care footprint percentage.
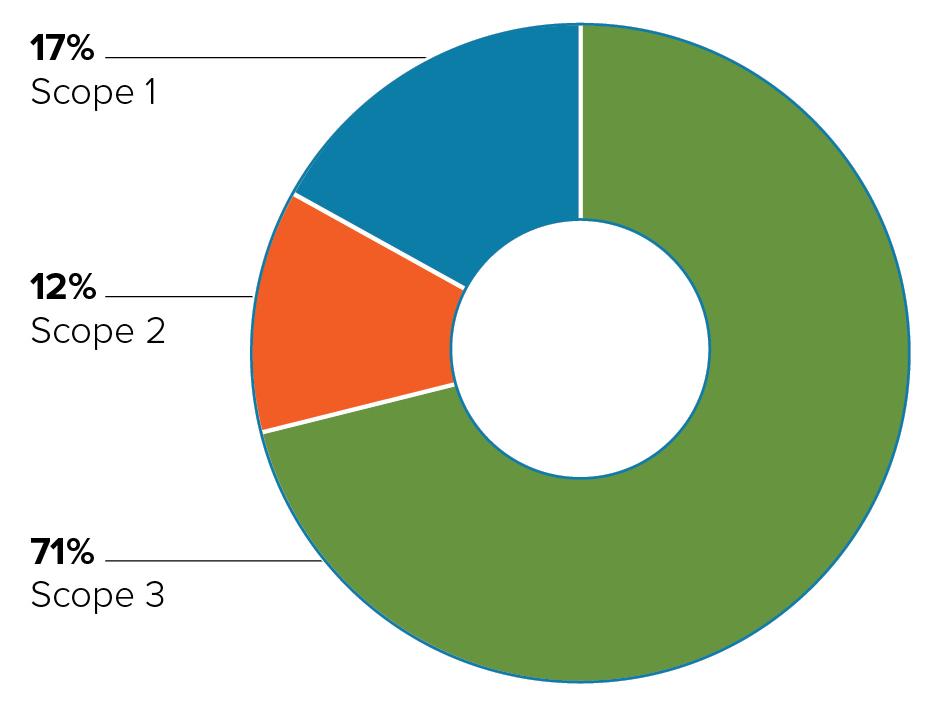
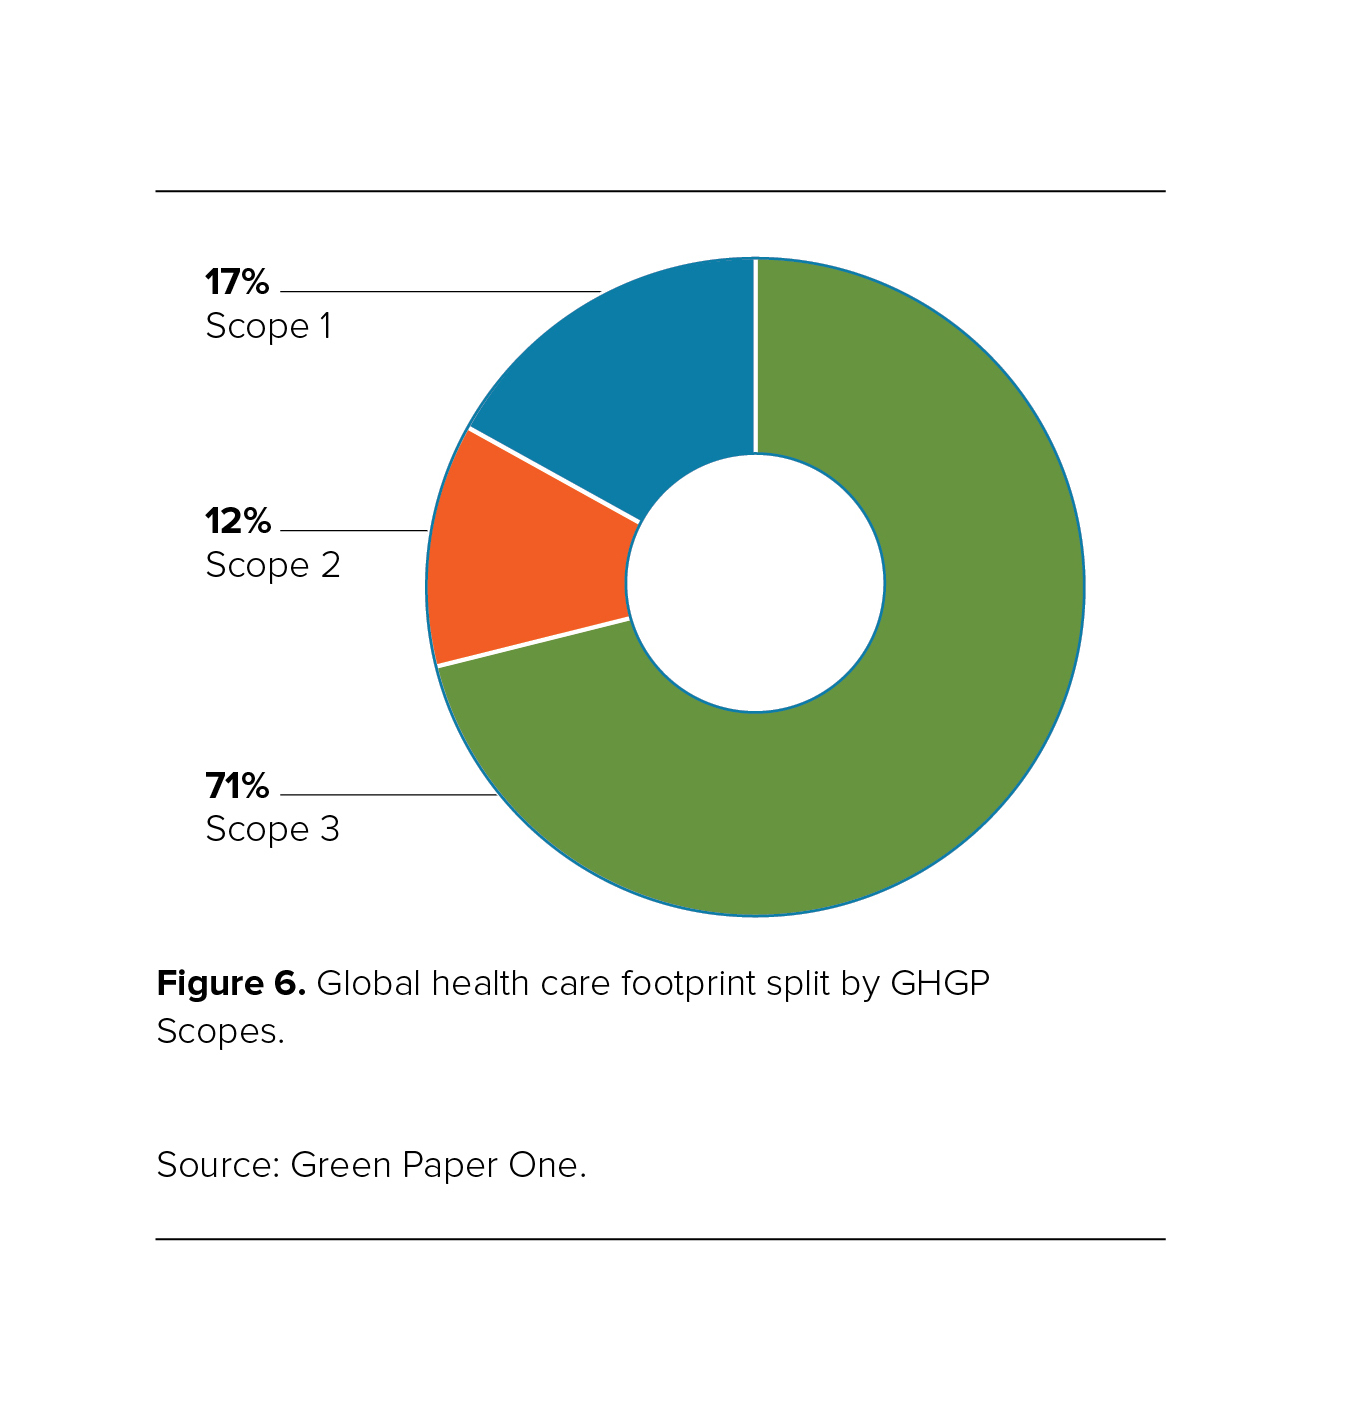
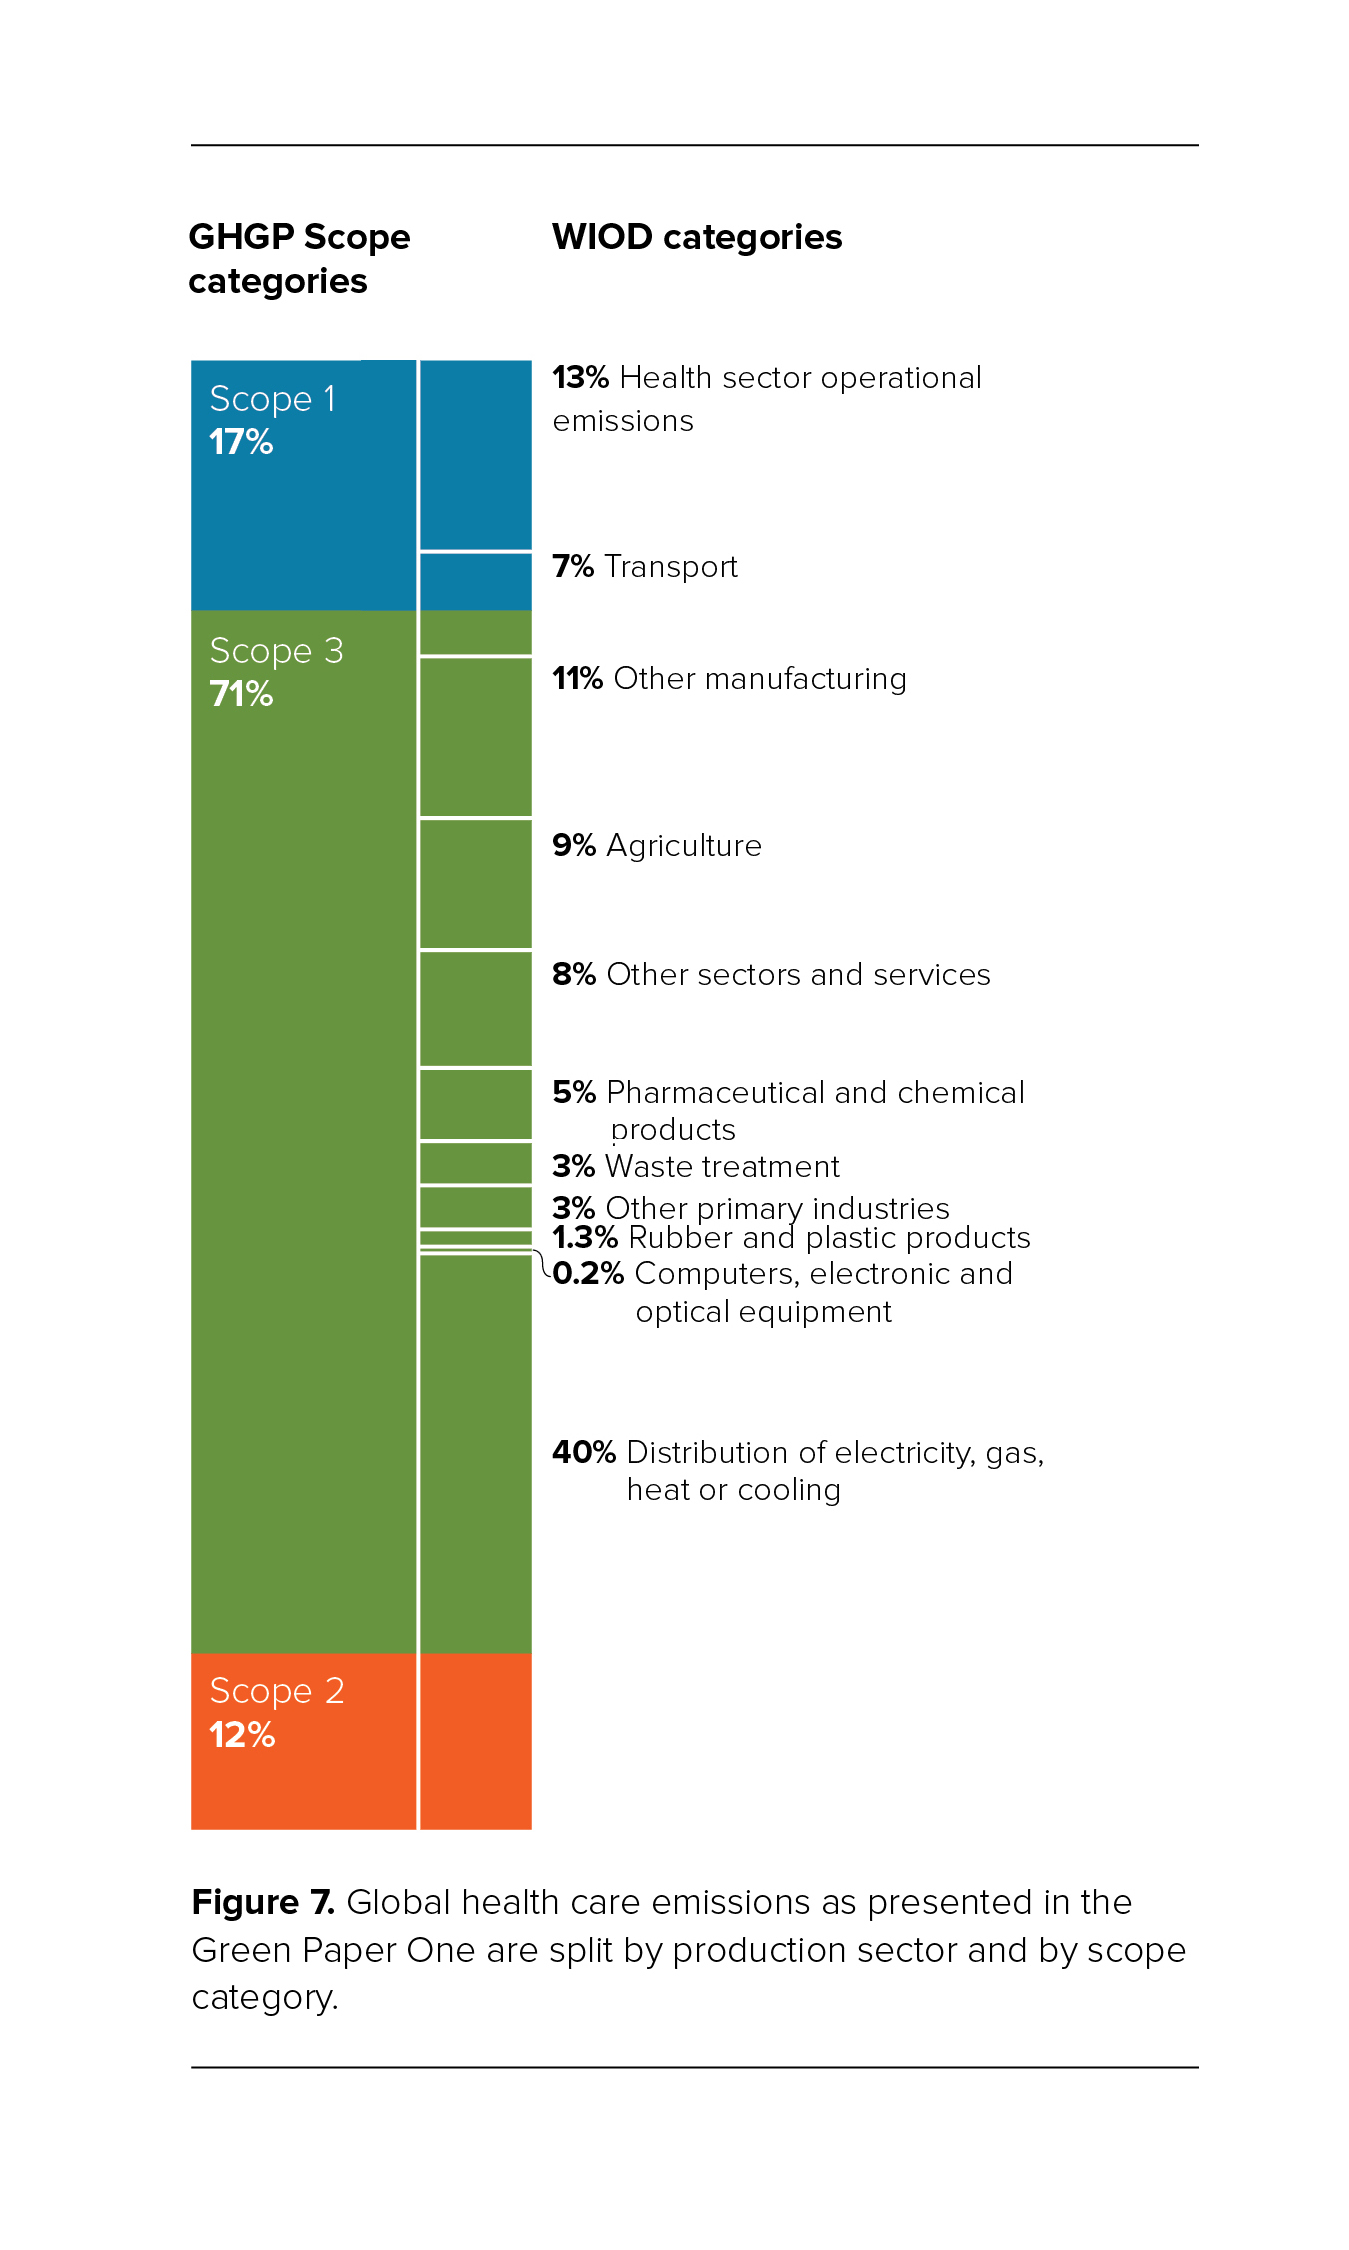
Global health care emissions divided by GHGP scope category.
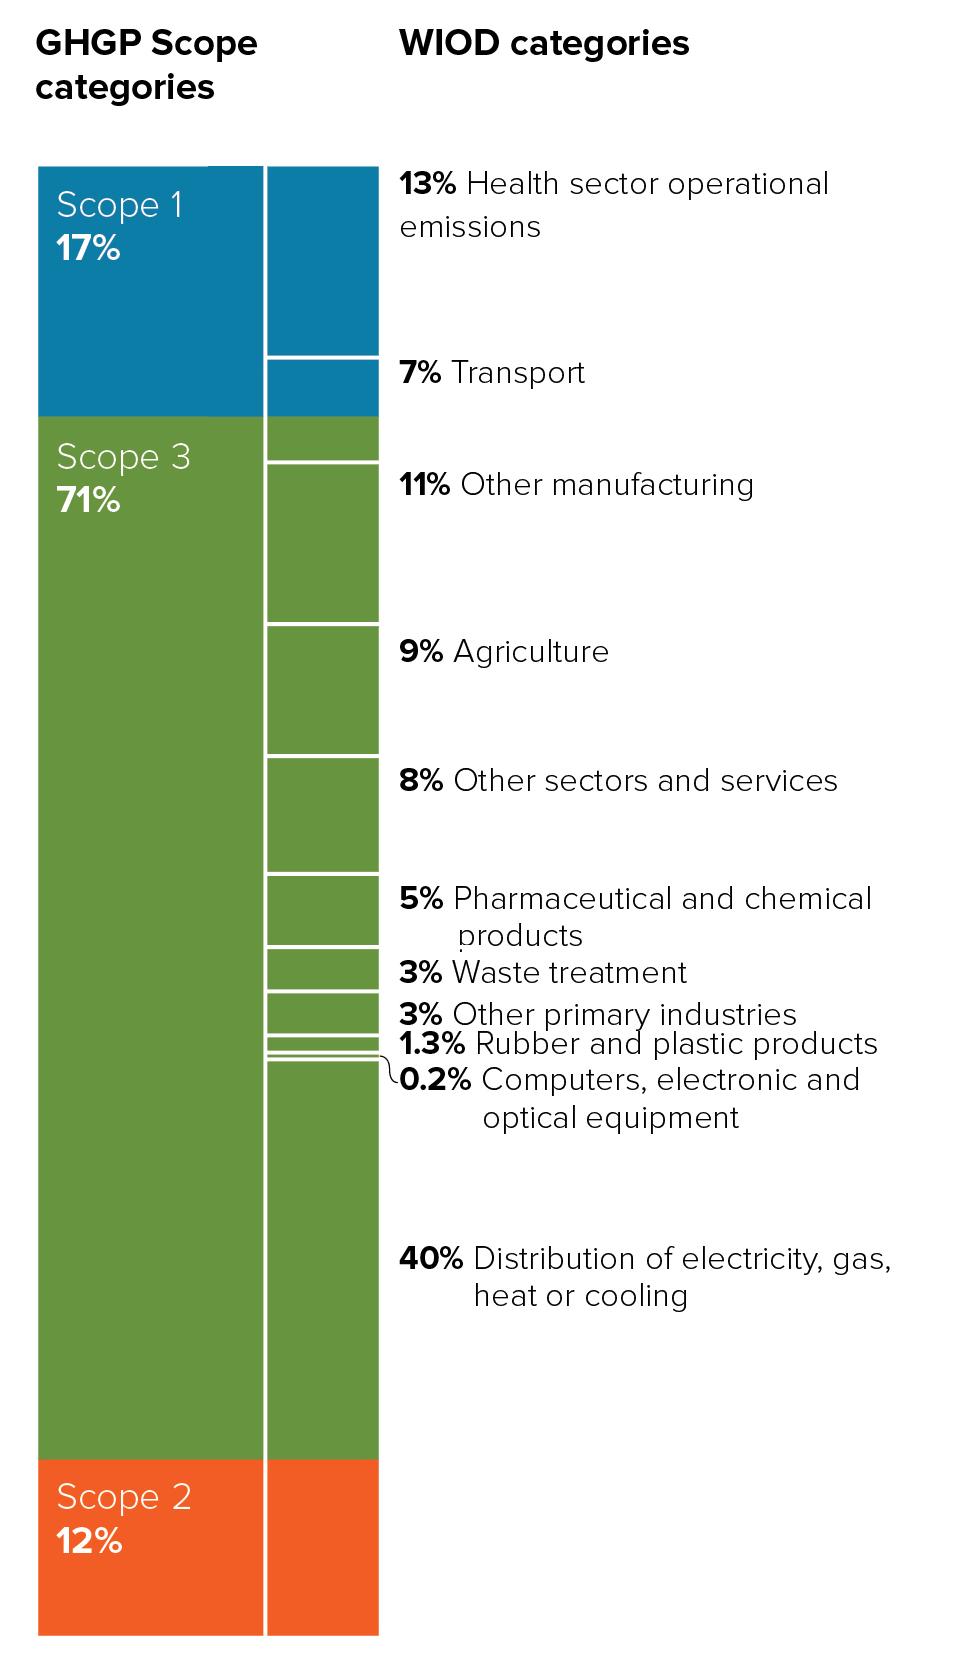
Global health care emissions segmented by production sector and by GHGP scope category.
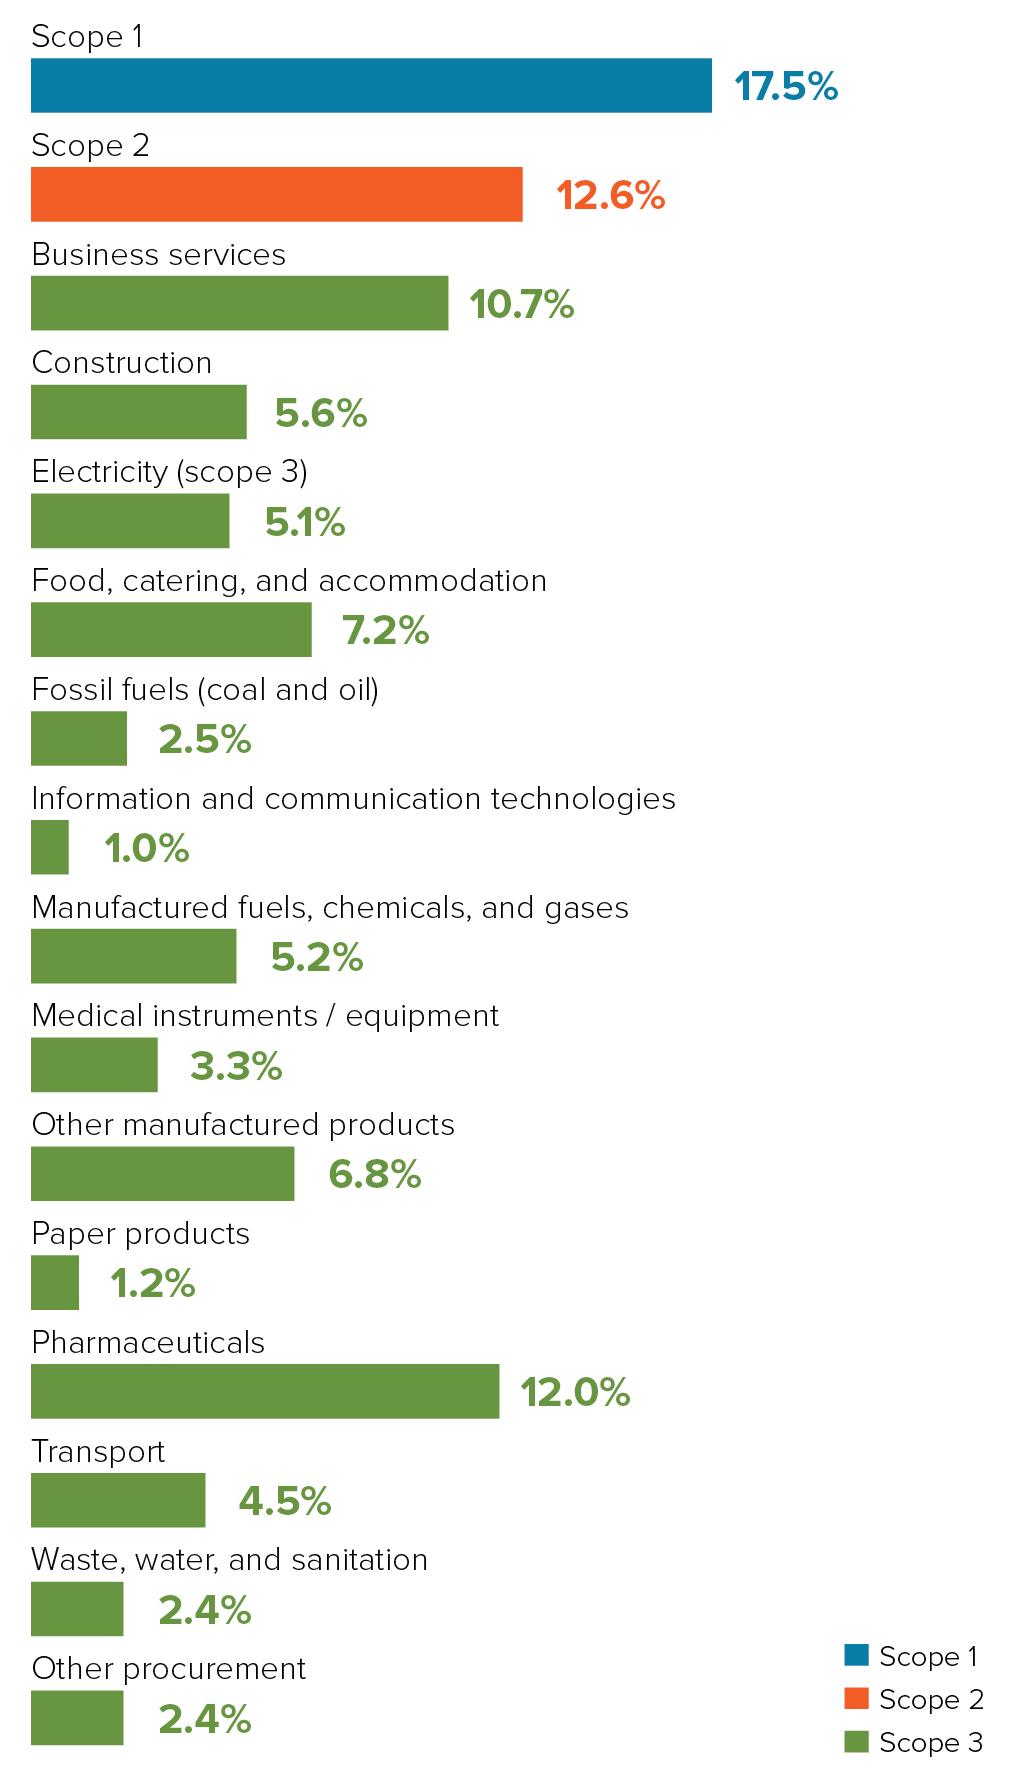
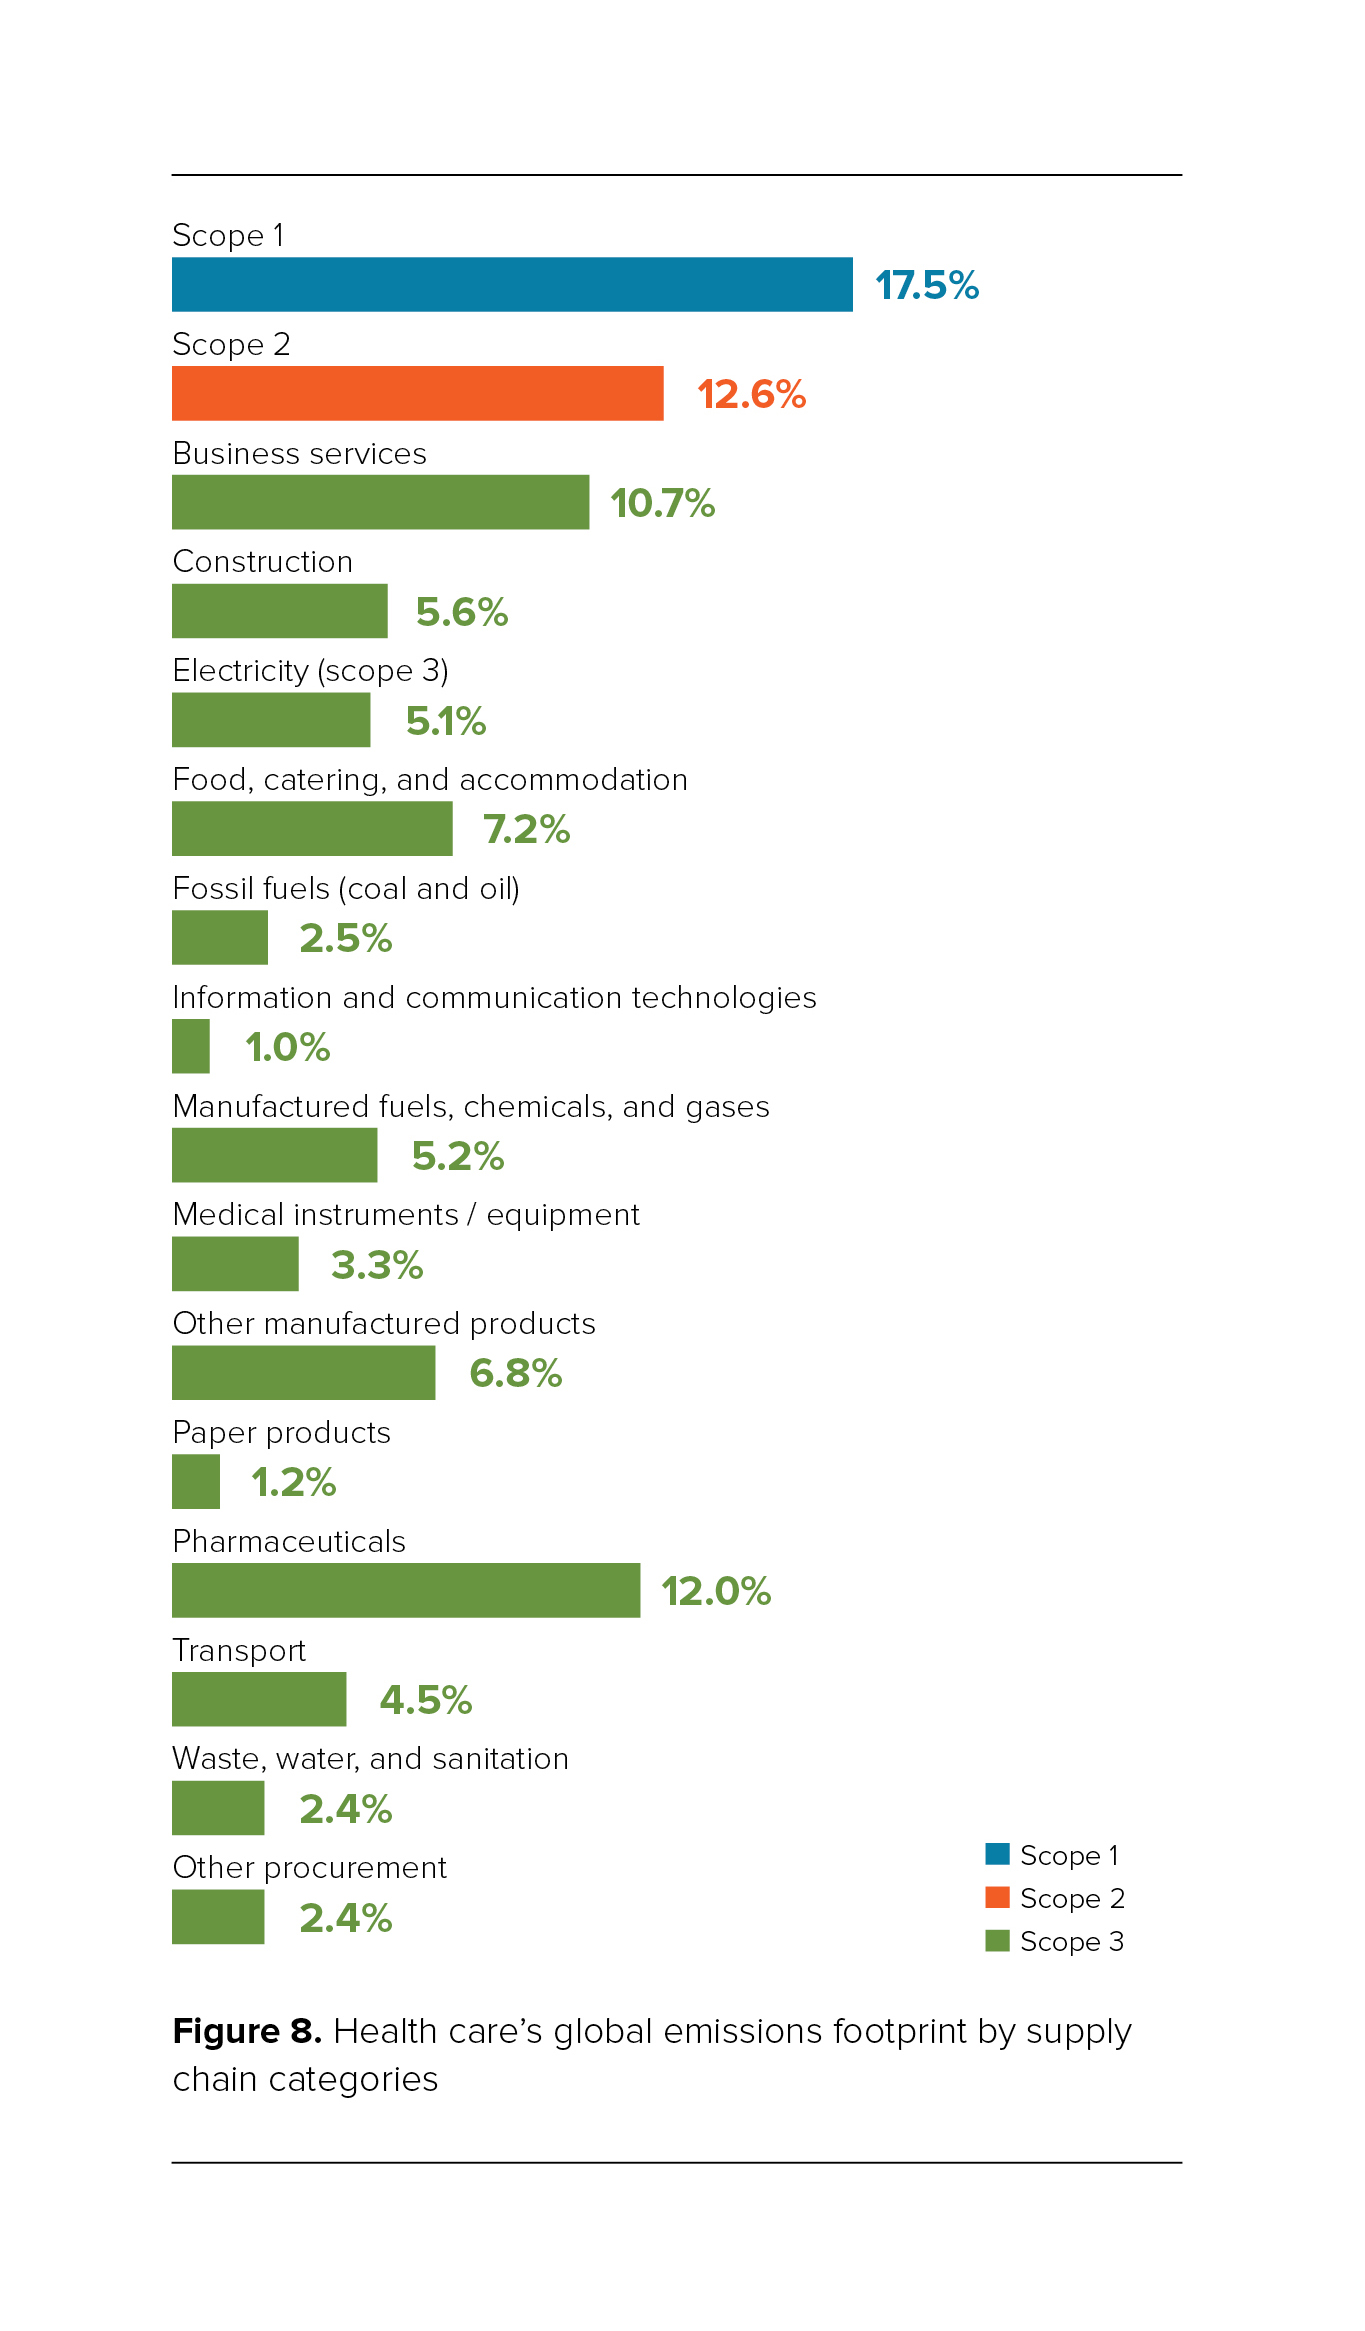
Health care's global emissions by supply chain categories.
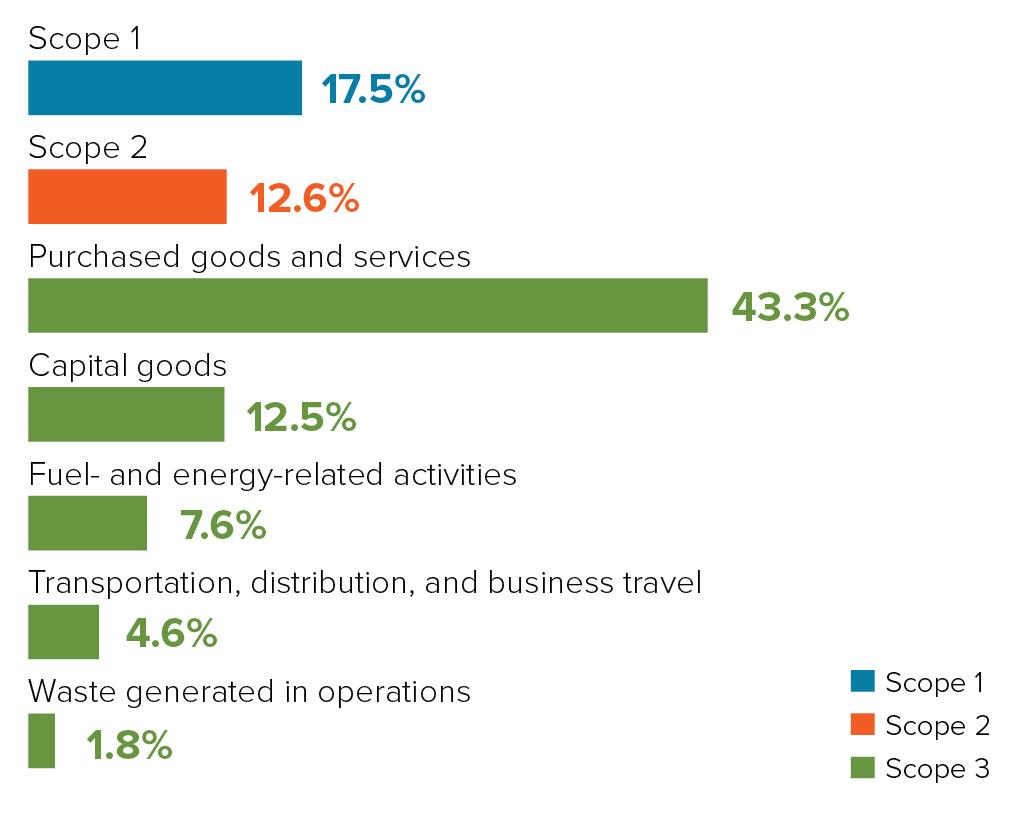
Health care global emissions by GHGP supply chain categories and sub-categories.
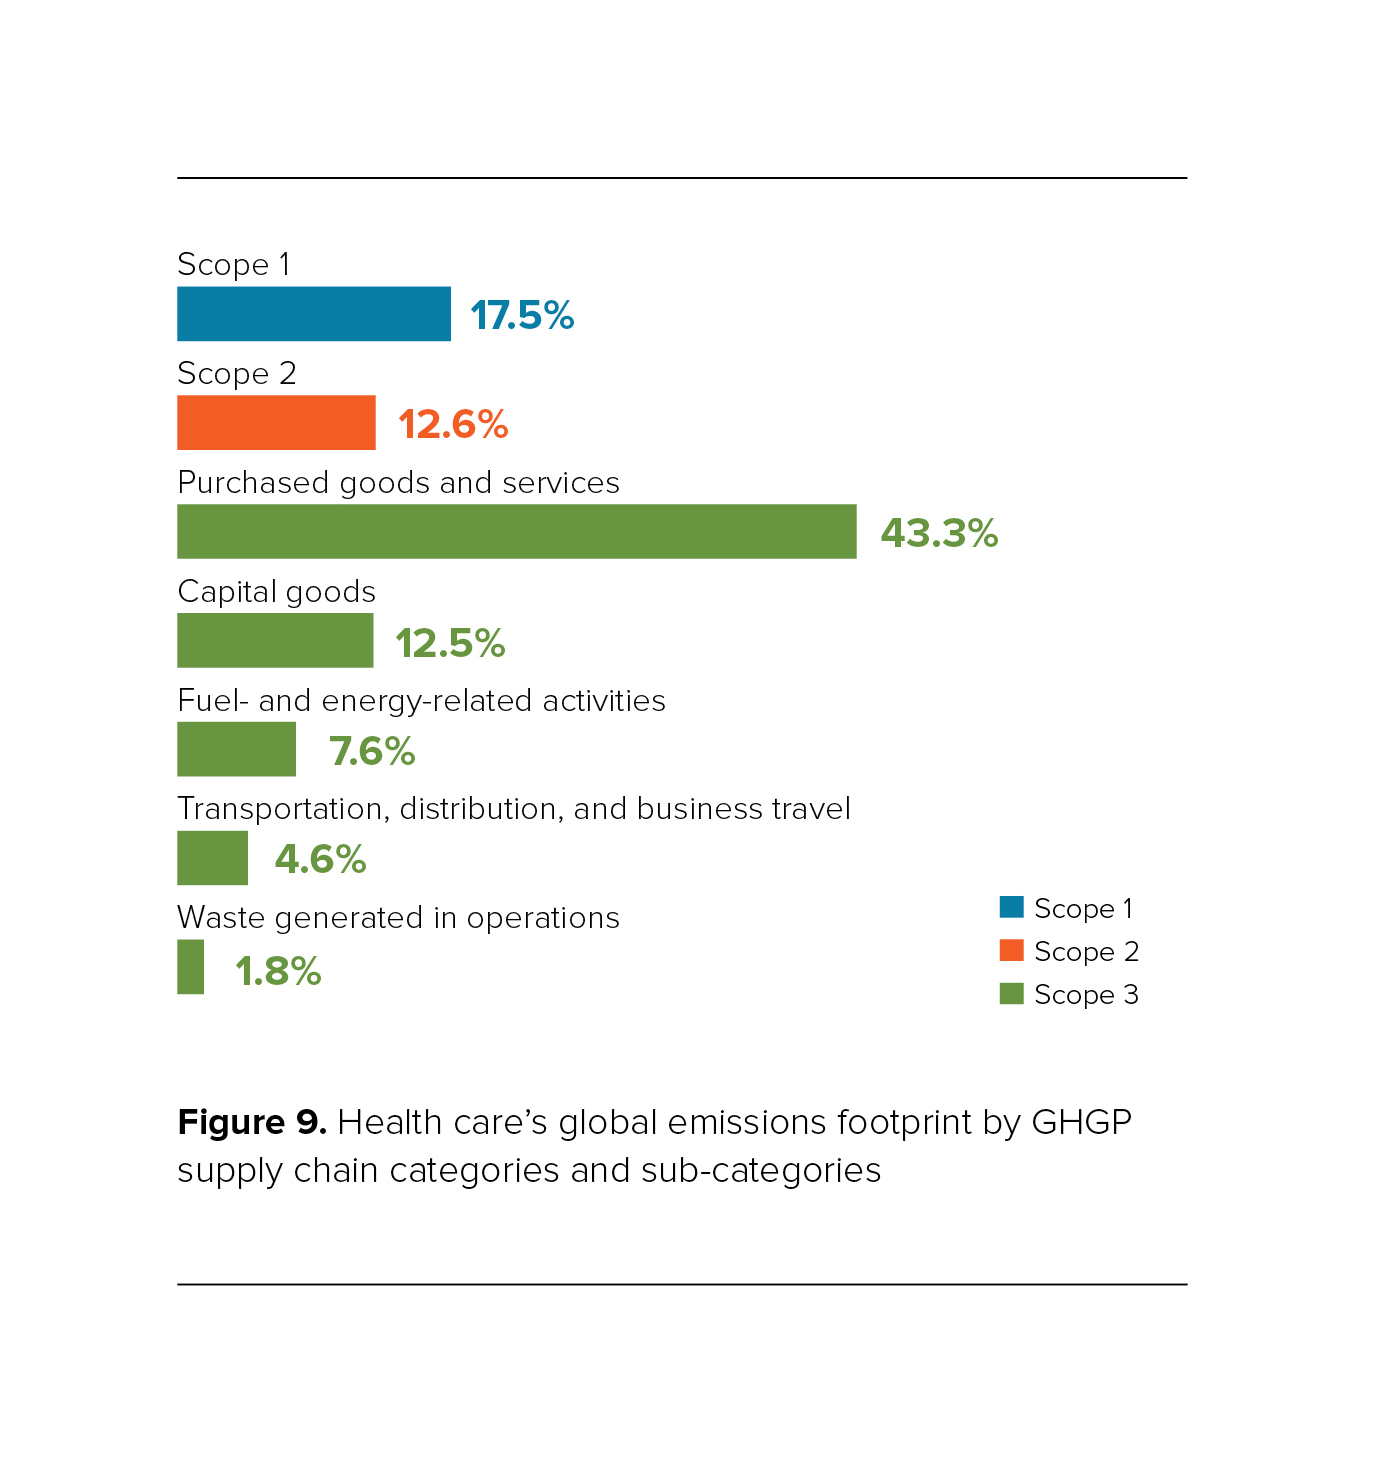
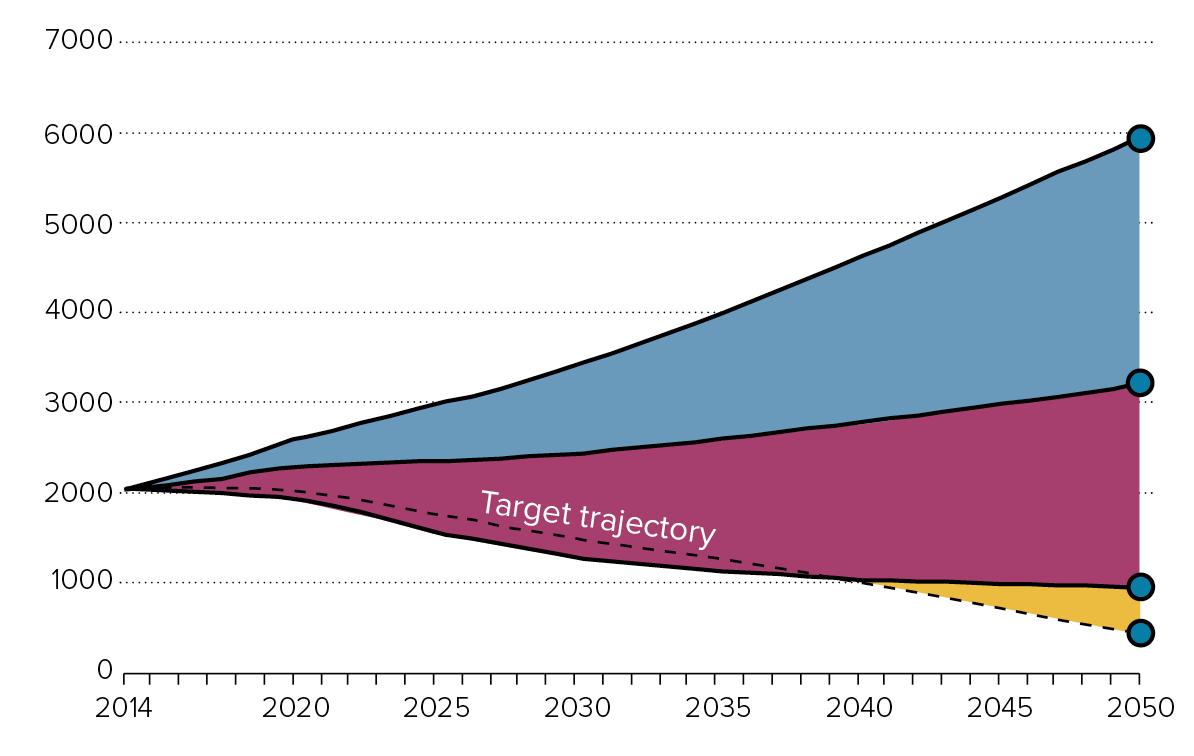
Comparison of per capita global health care emissions projections: 1. Business as usual (growth in demand), 2. achieving Paris commitments made up to 2017 (RTS), 3. ambitious decarbonization of the wider economy (B2DS), and 4. target trajectory of deep health sector decarbonization—includes the three pathways, 7 high-impact actions and uncharted territory discussed in Chapter 5.
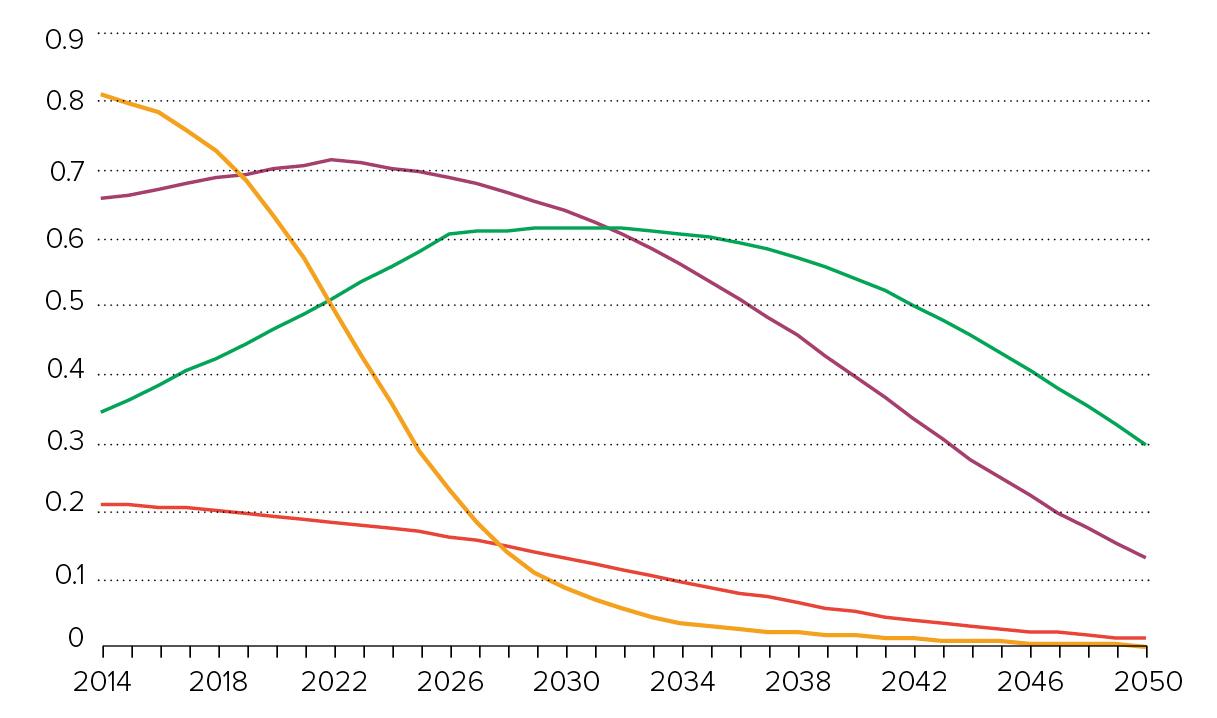
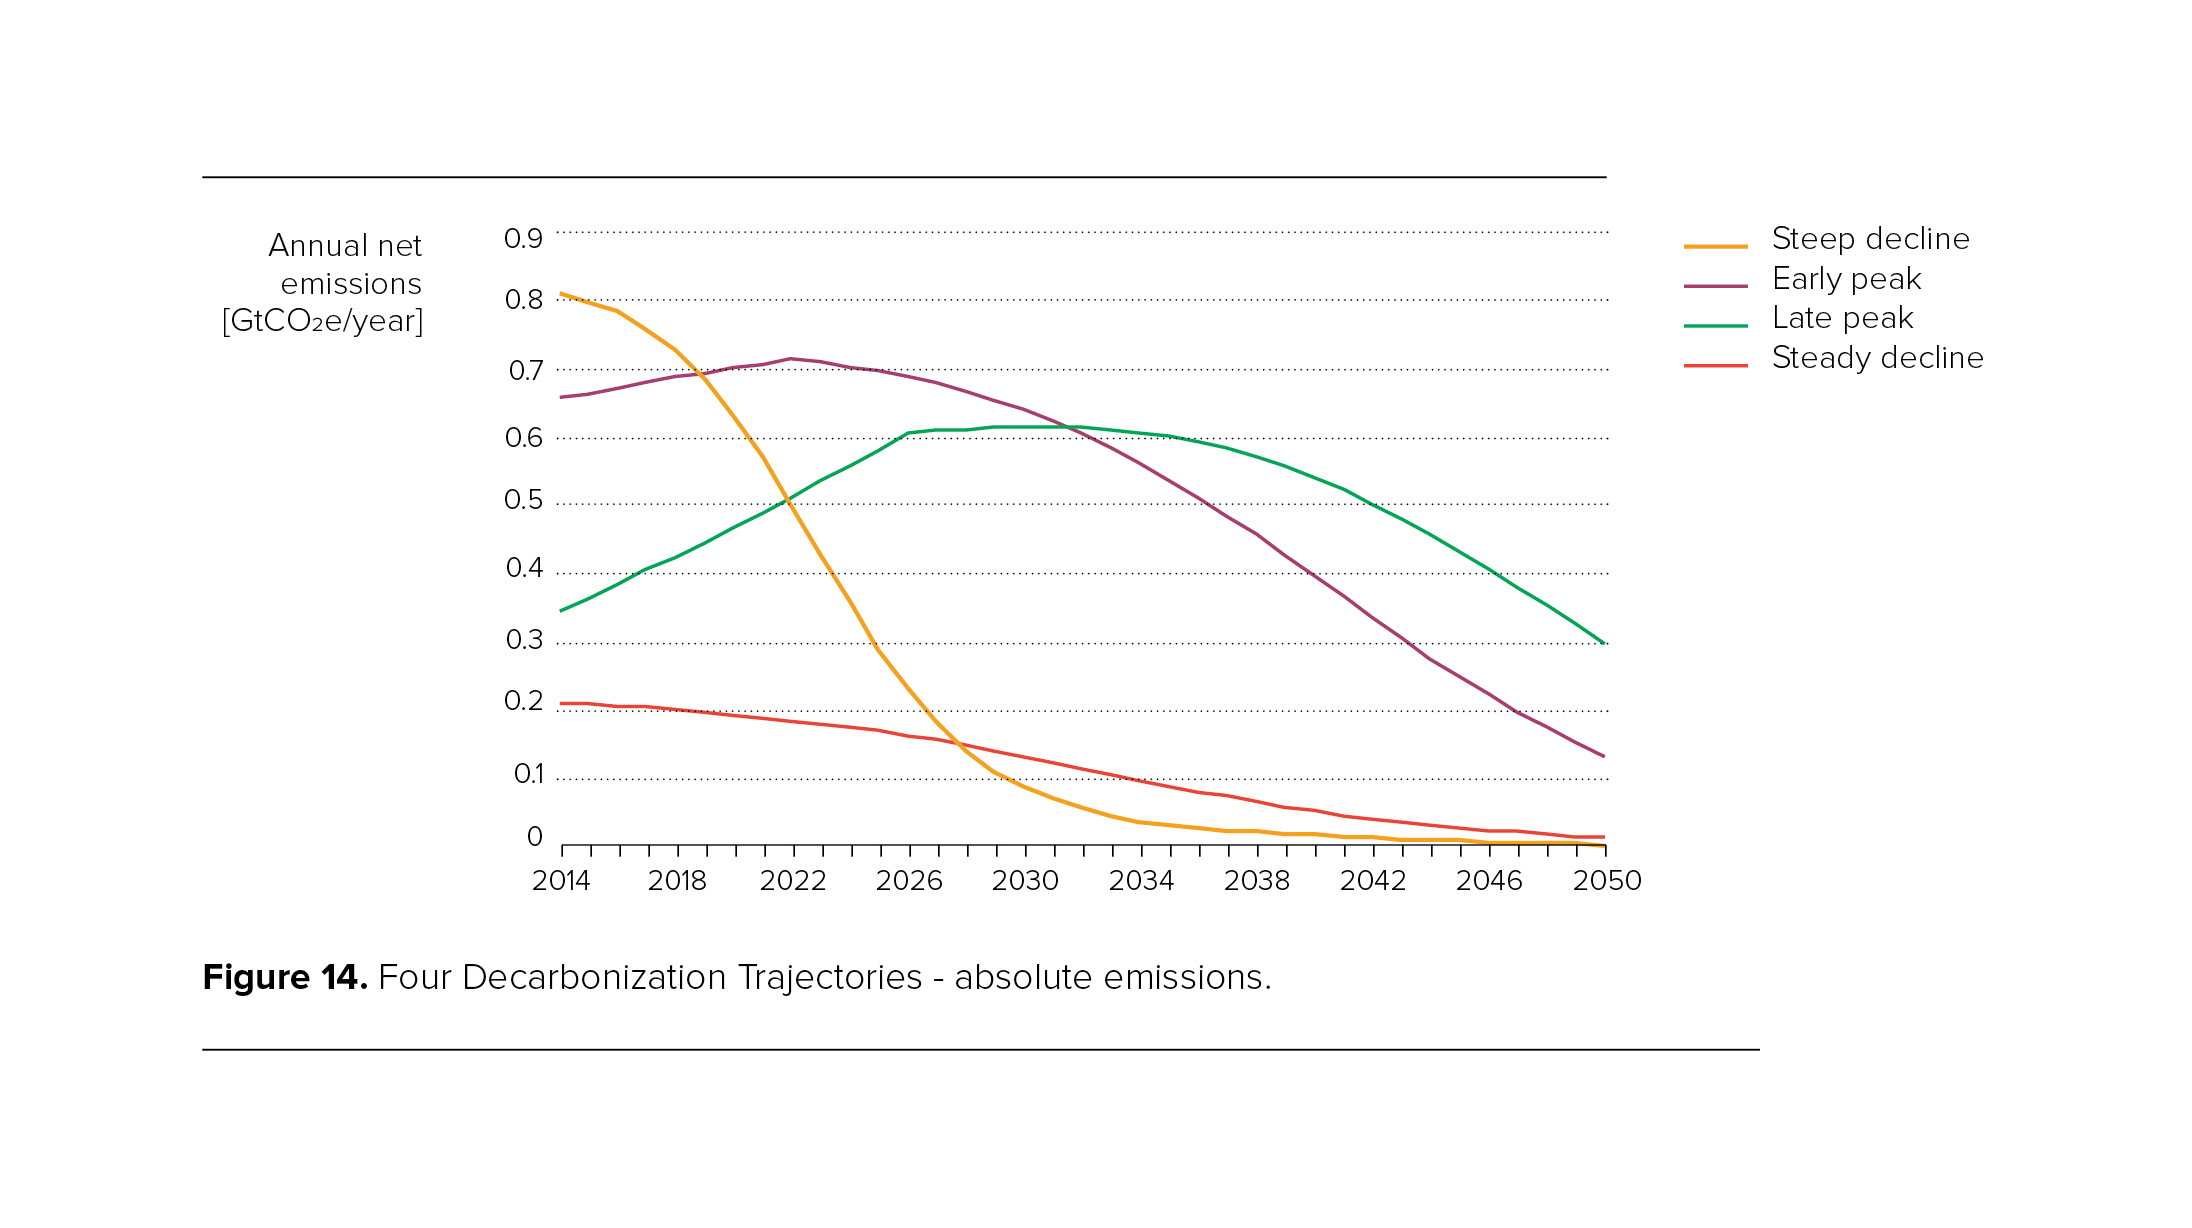
Four health care decarbonization trajectories - absolute emissions.
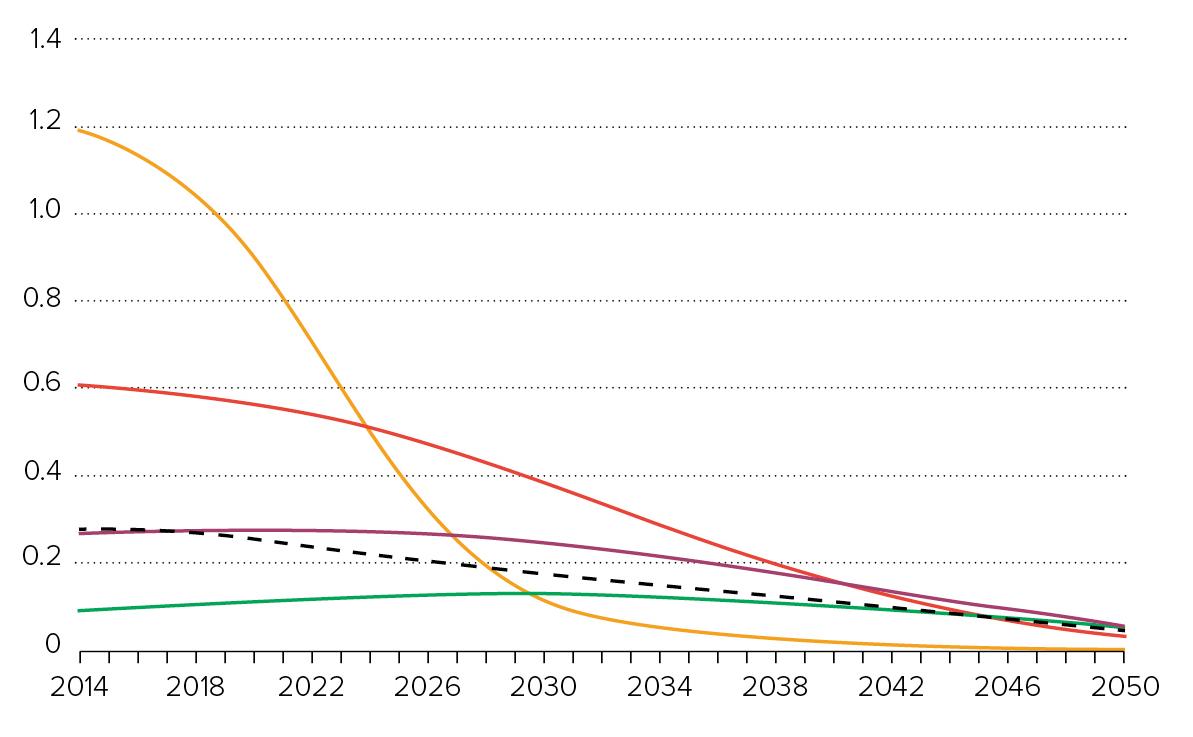
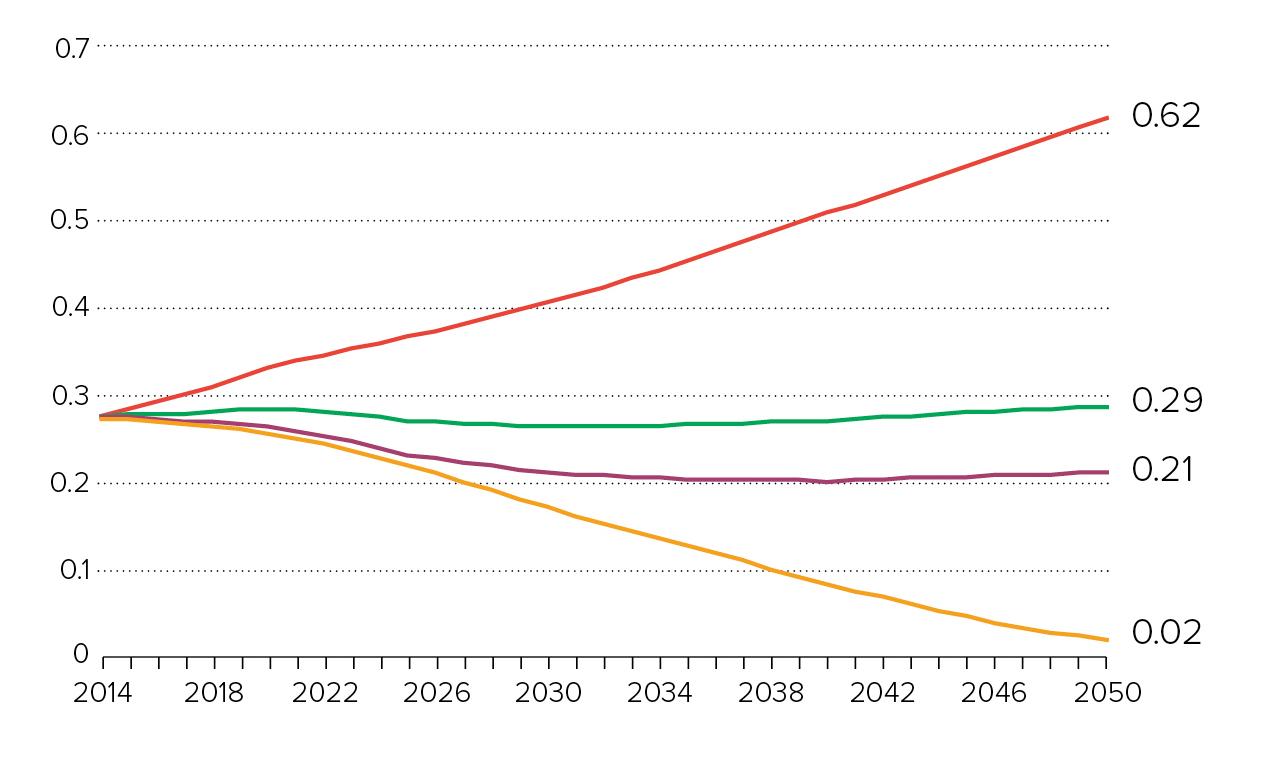
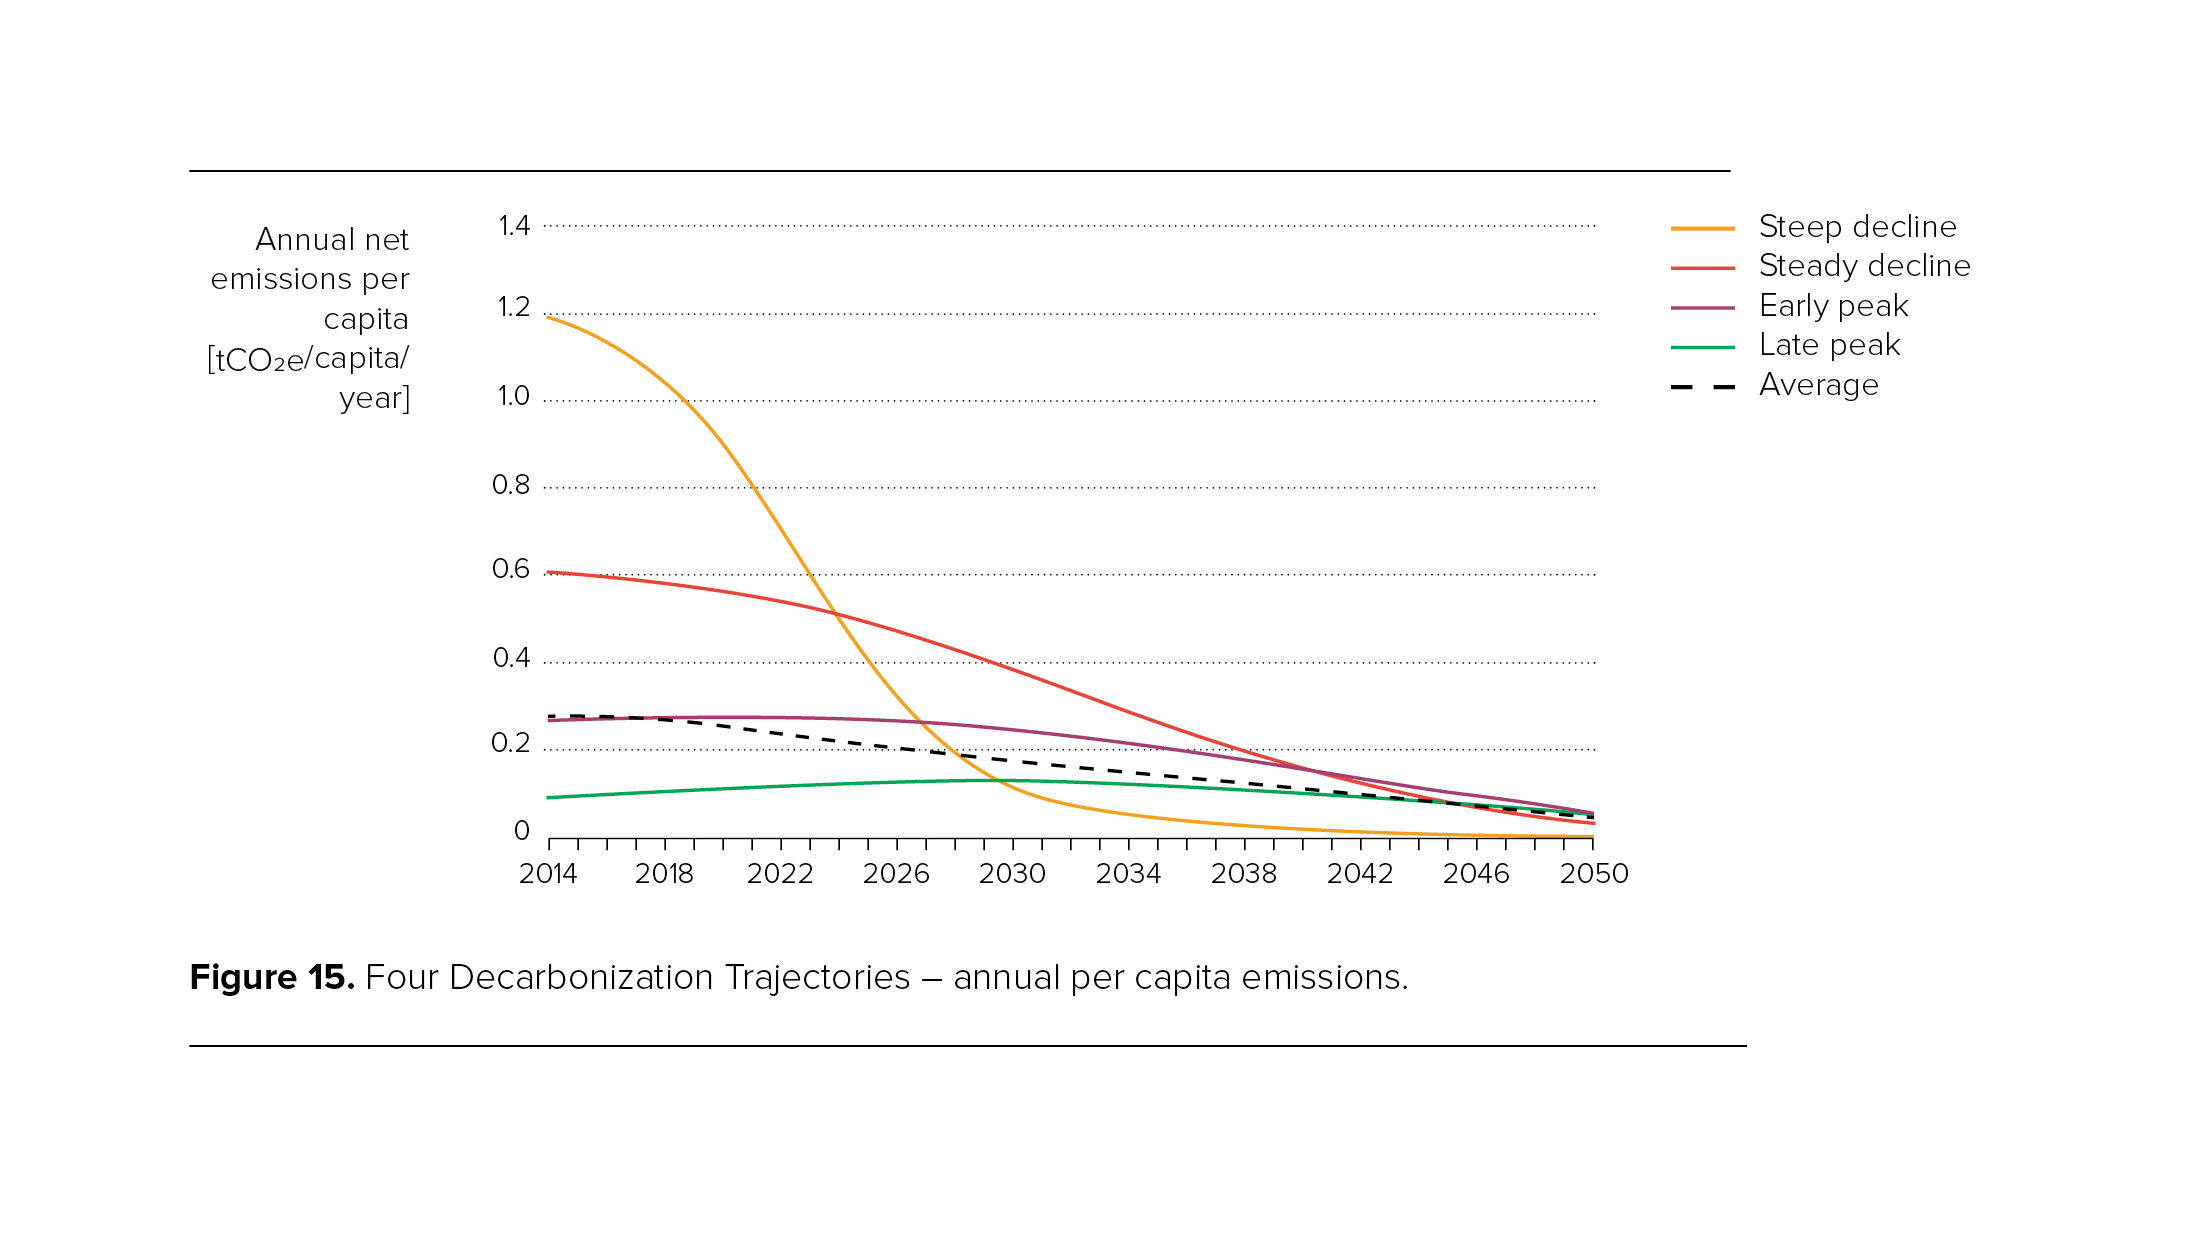
Four health care decarbonization trajectories – annual per capita emissions.
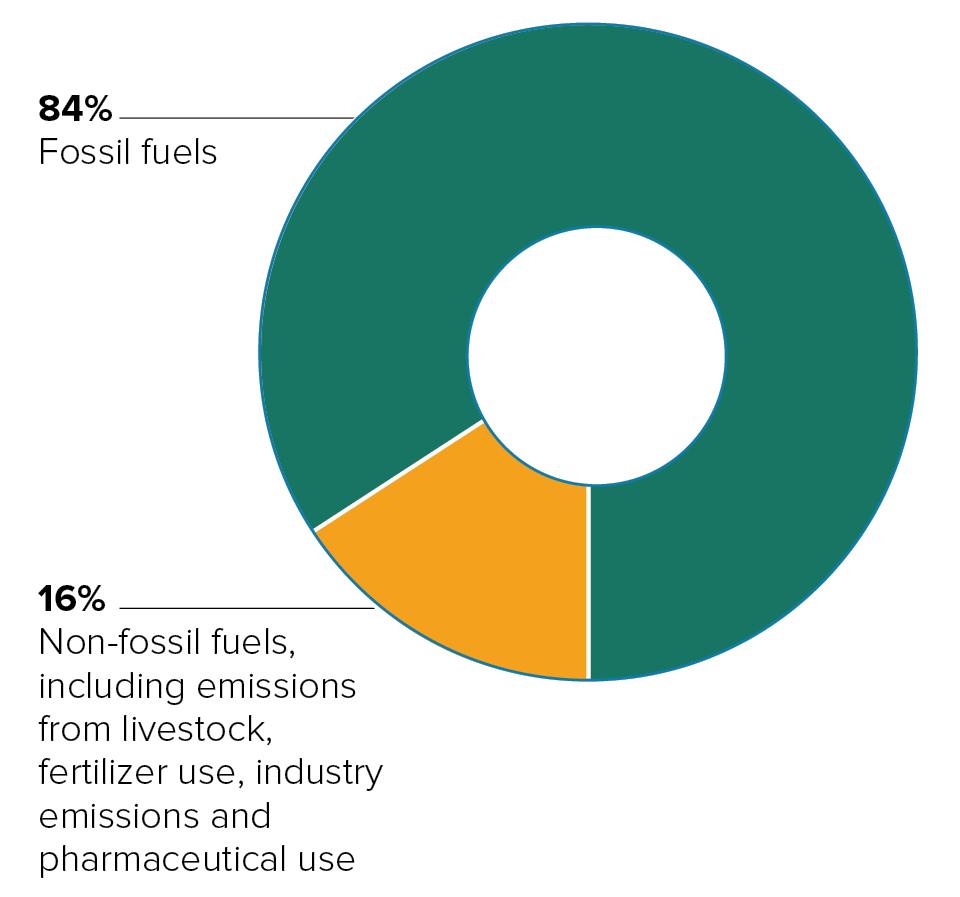
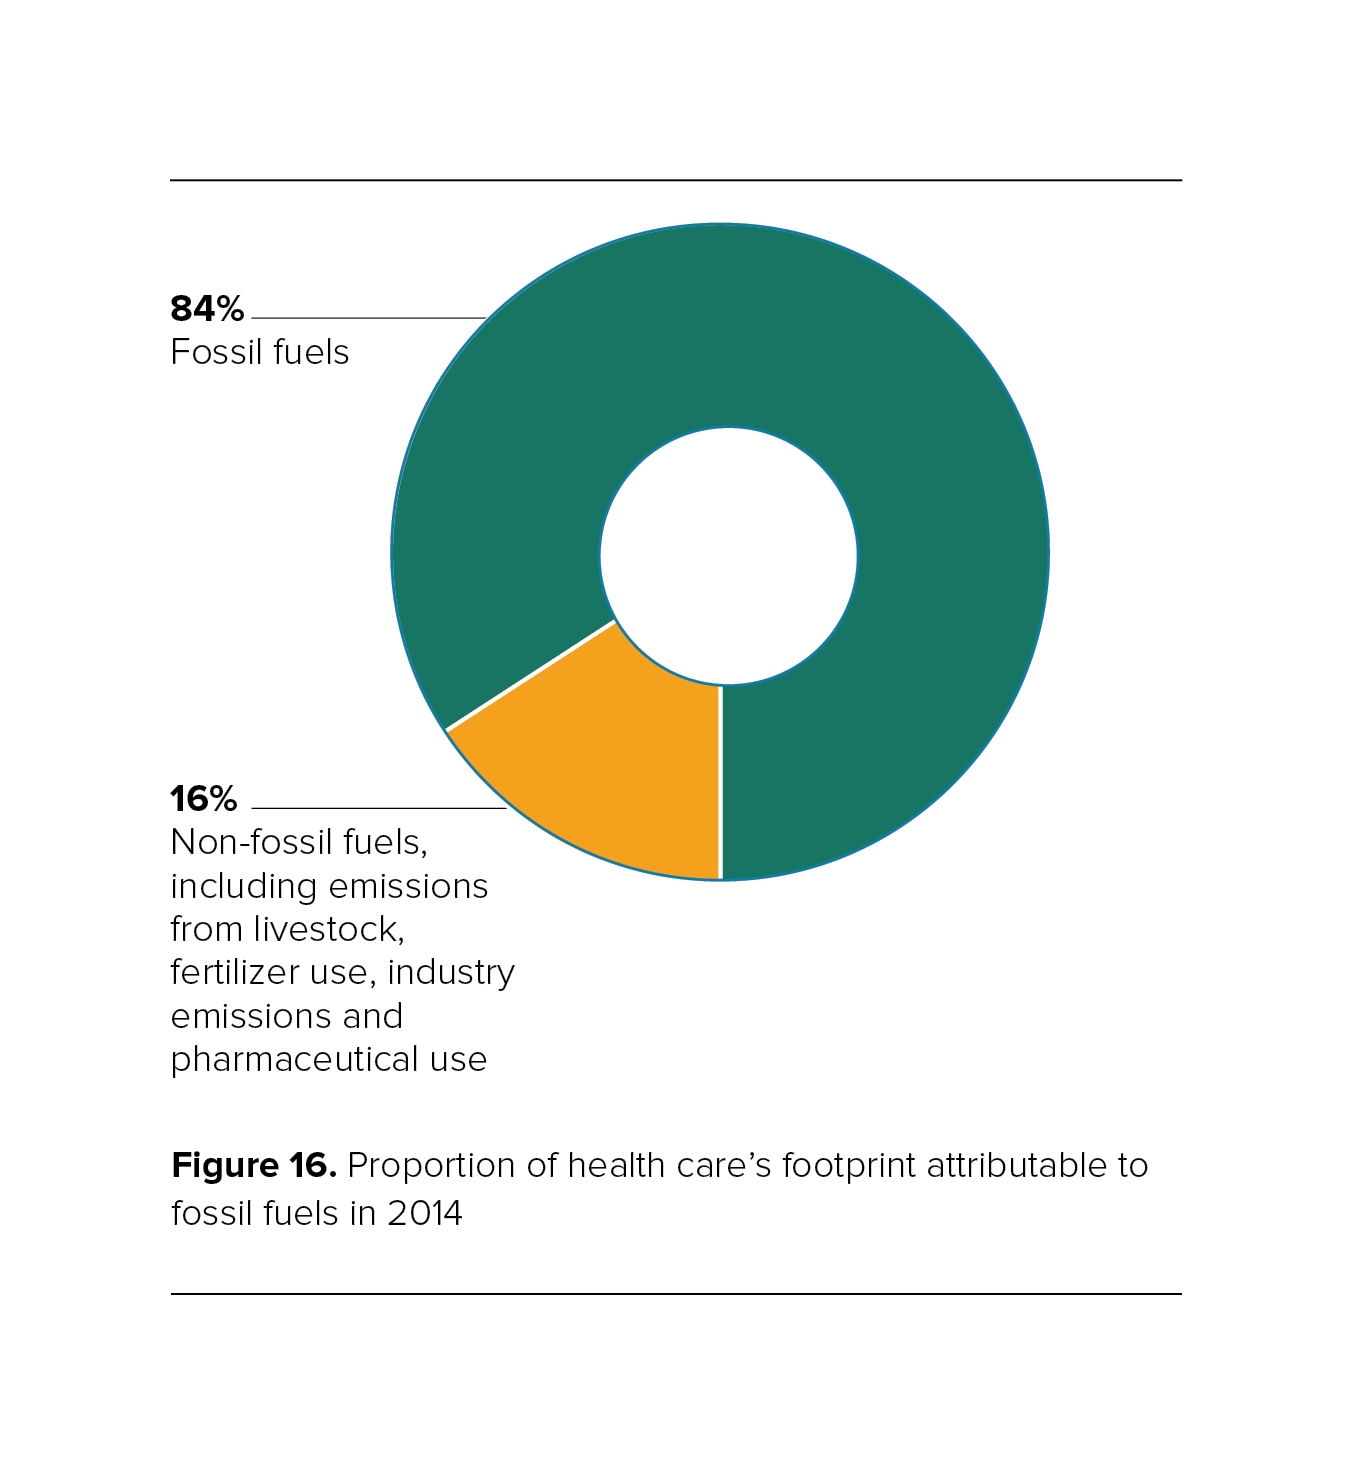
Proportion of health care's footprint attributable to fossil fuels in 2014.
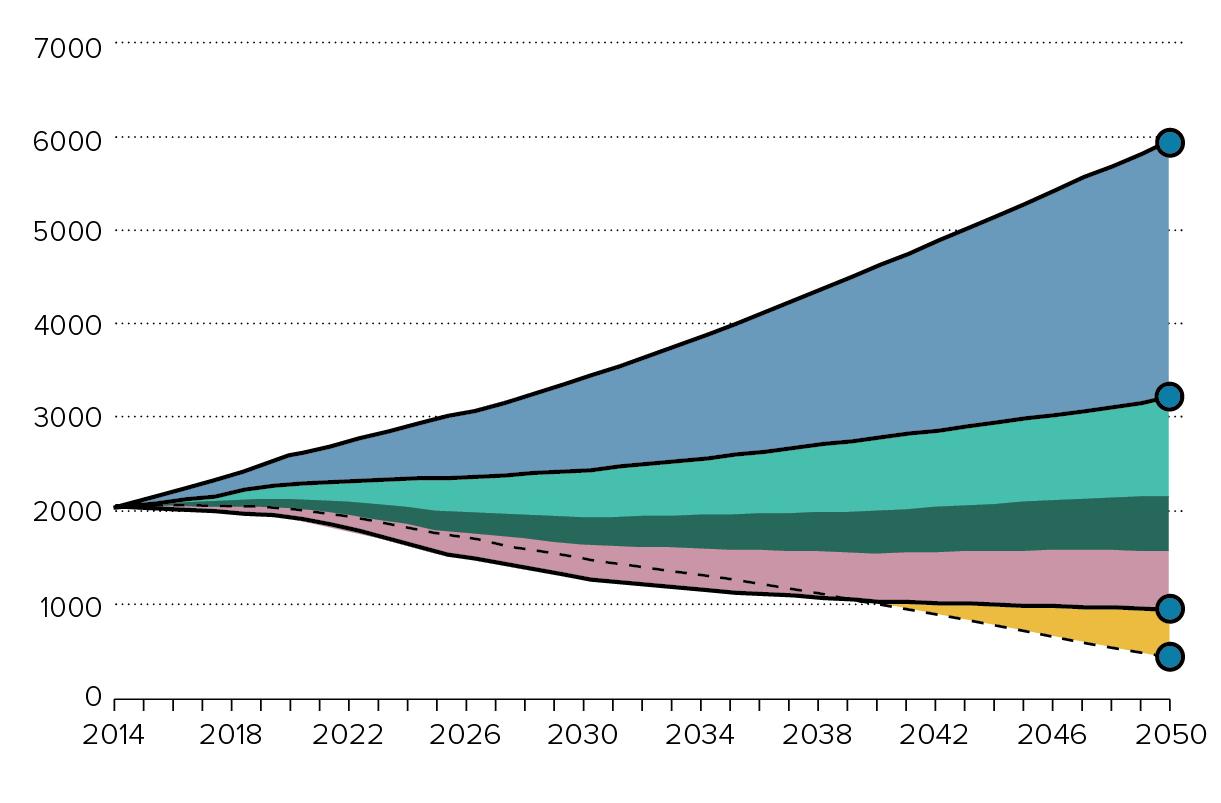
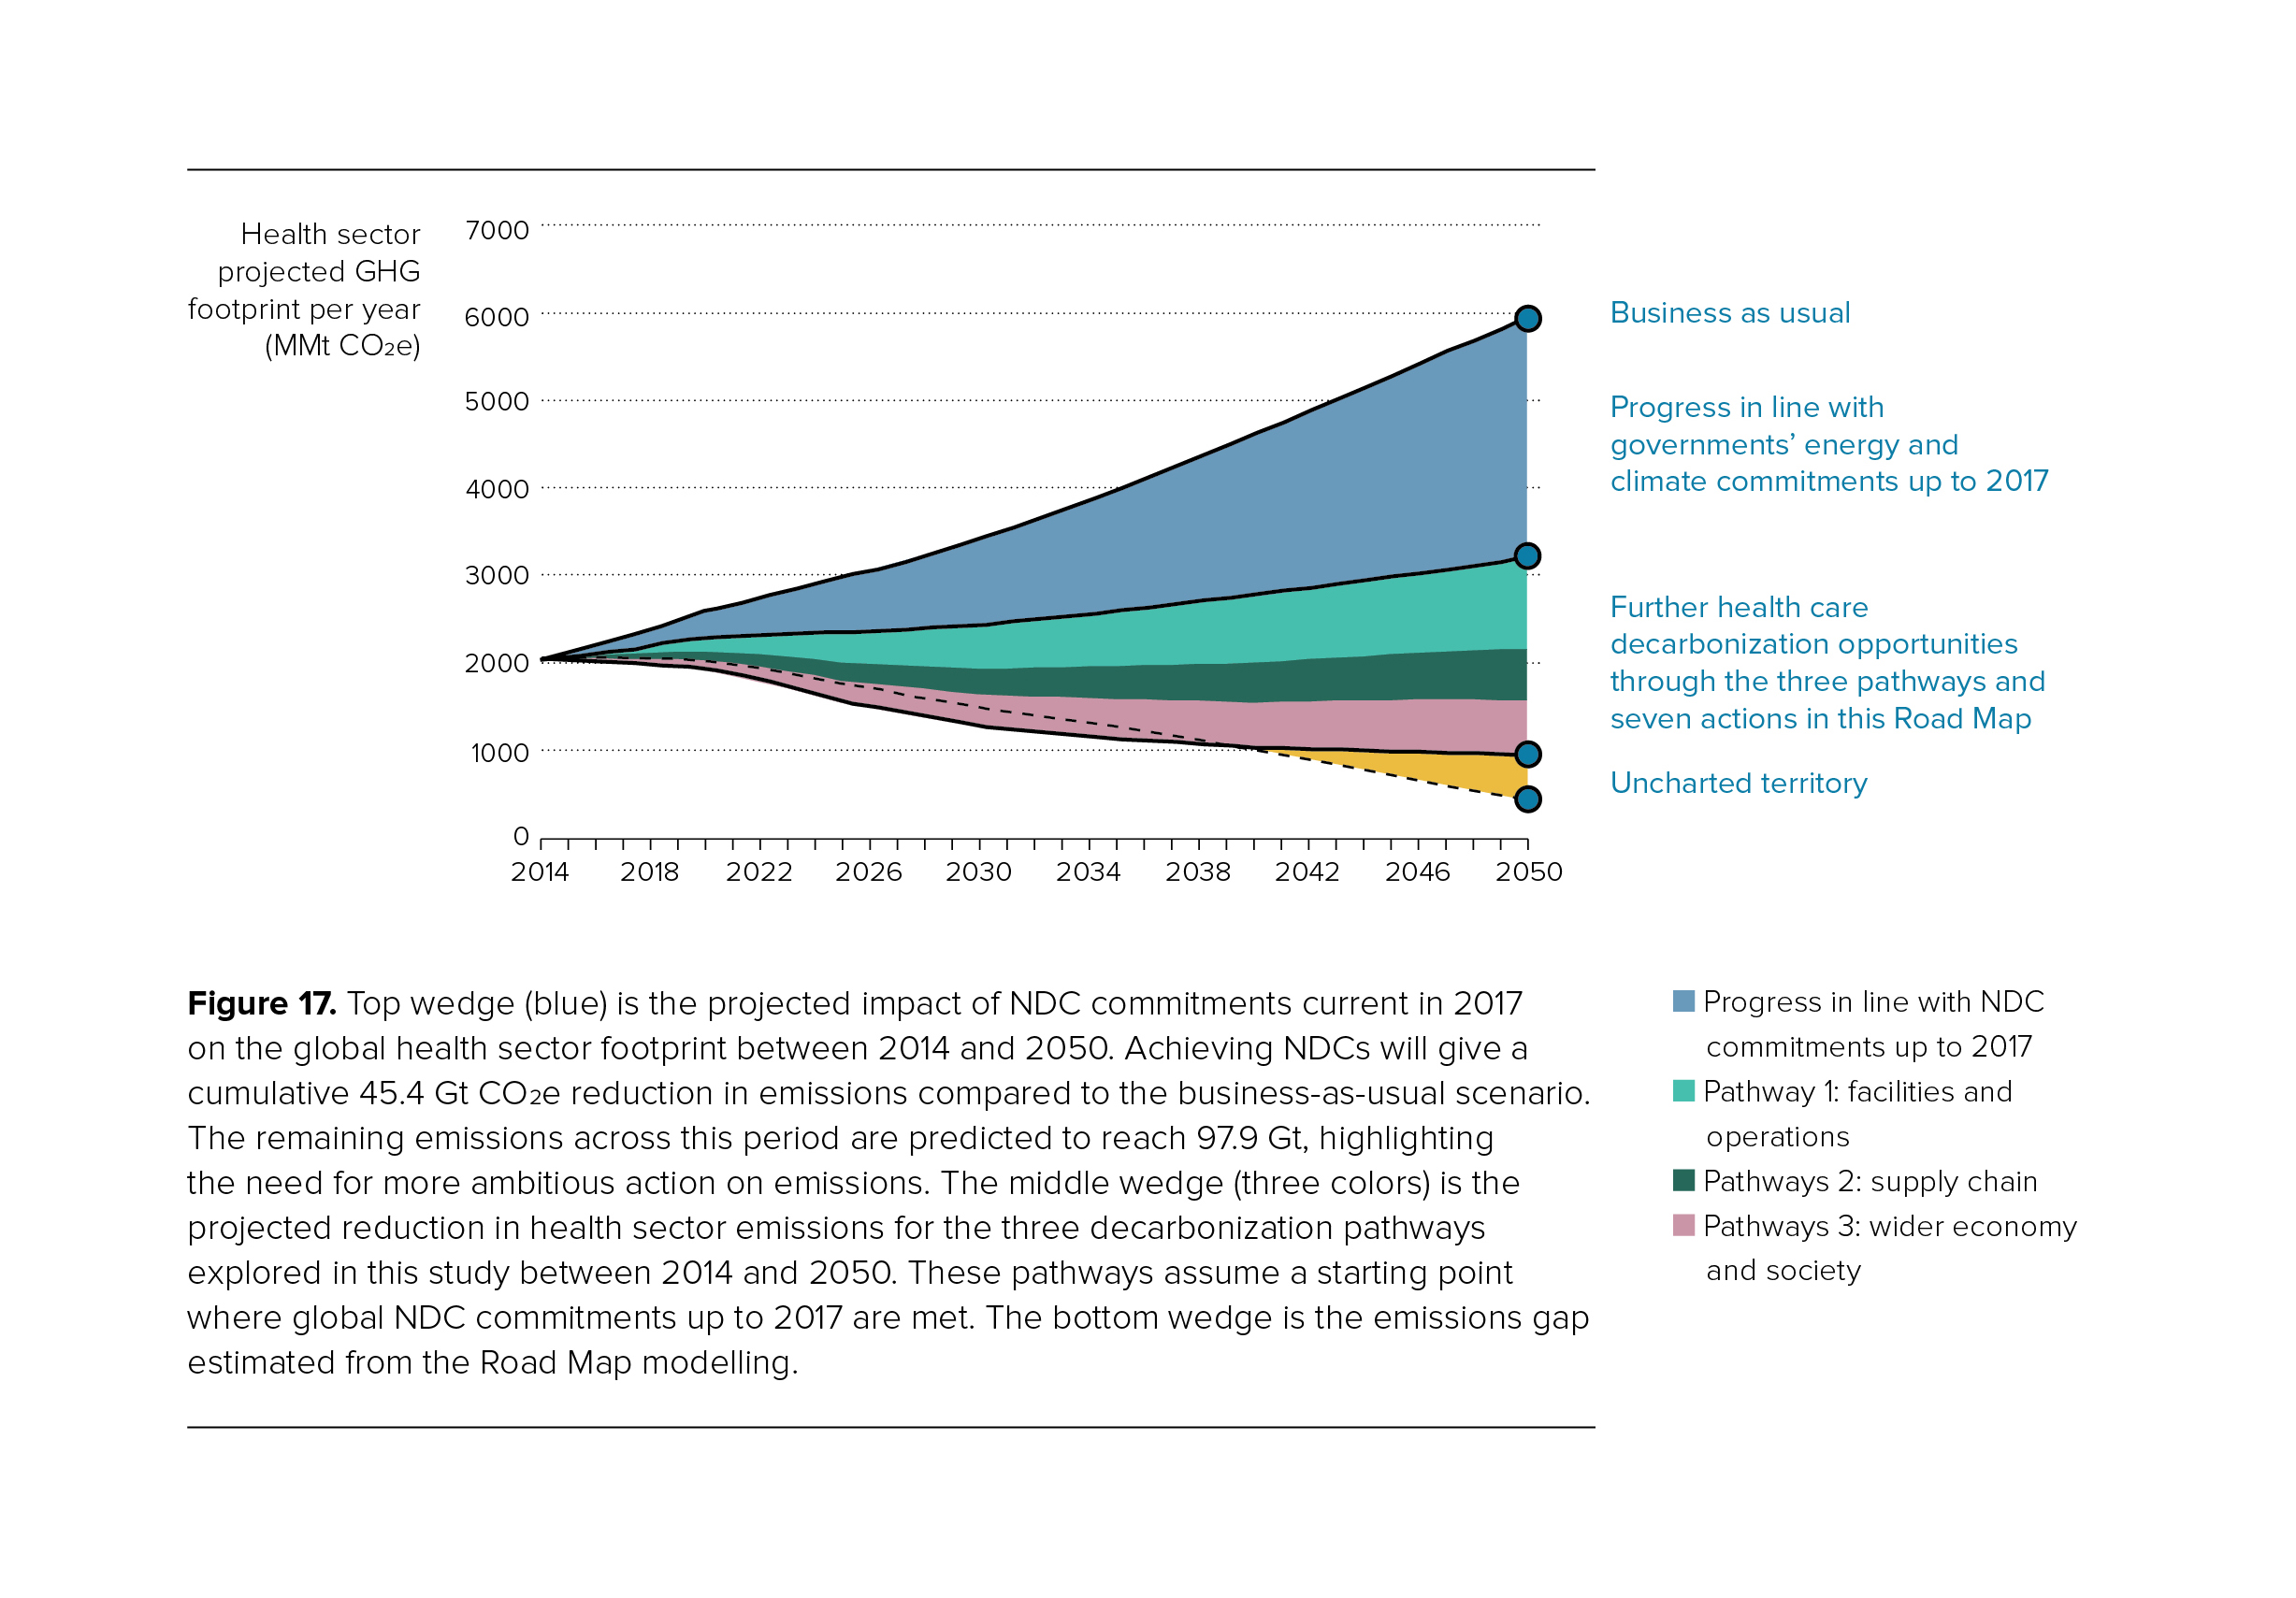
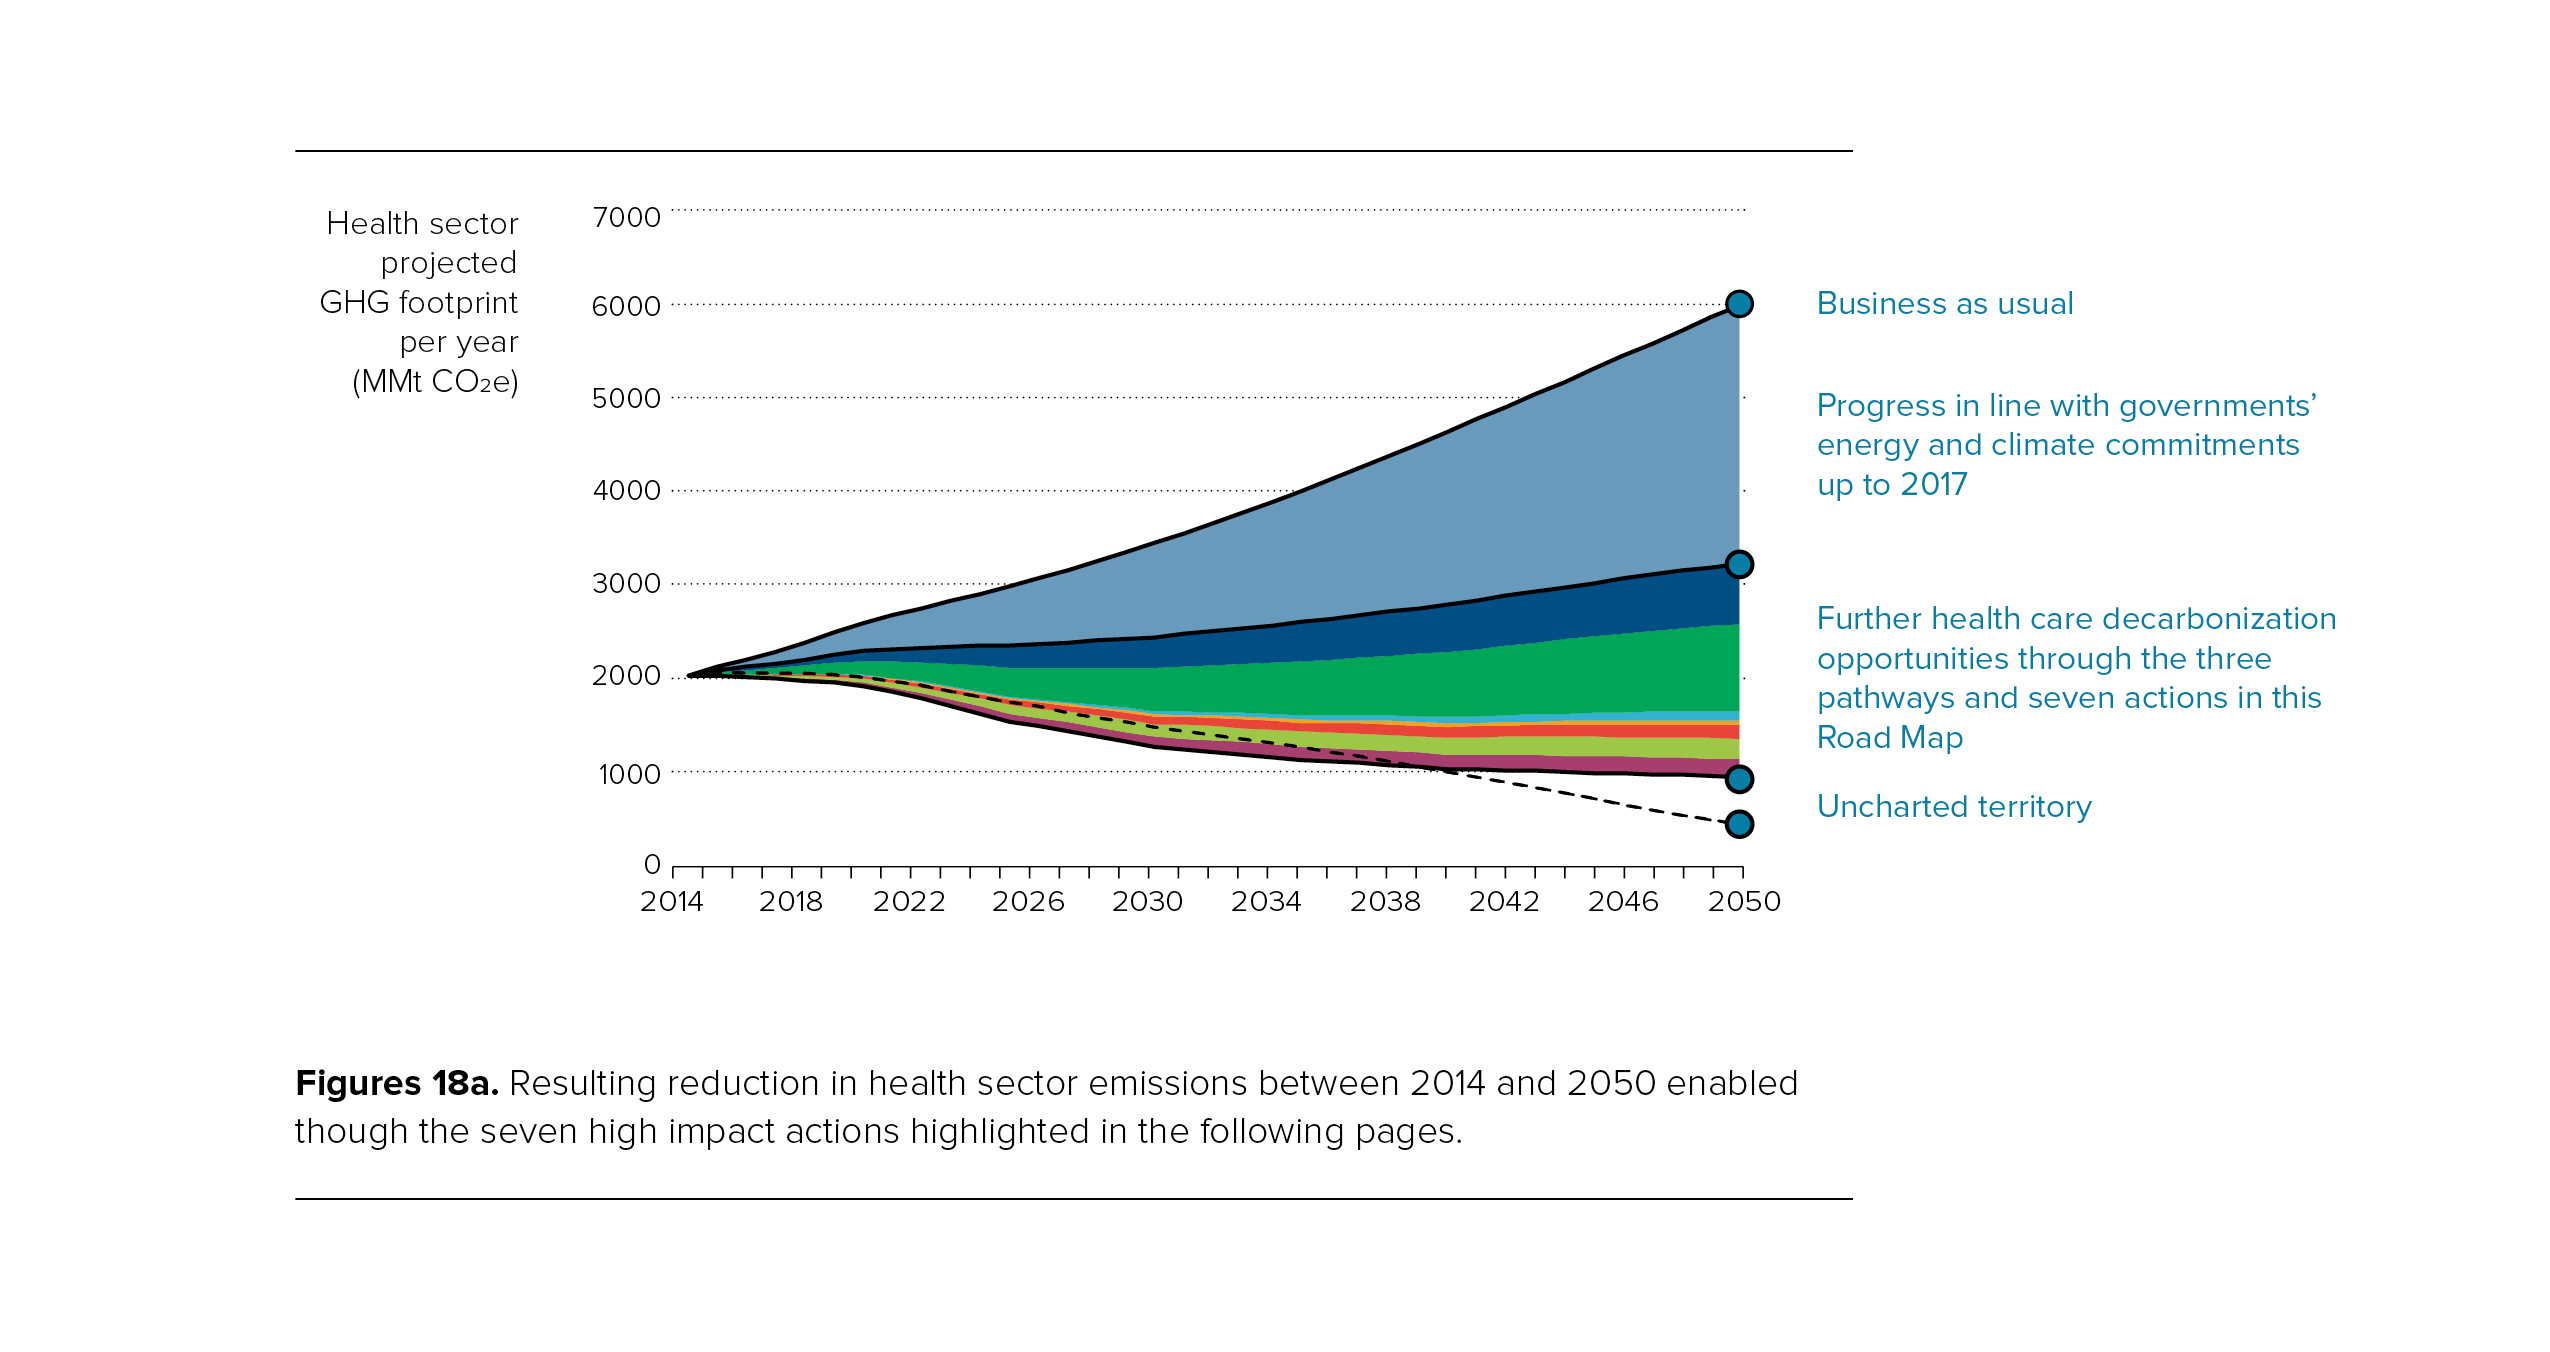
Comparison of emissions: 1. Business as usual (growth in demand); 2. Progress in line with governments' climate commitments up to 2017 3. projected reduction in health sector emissions resulting from the three decarbonization pathways explored in the Road Map and 4. The remaining emissions gap.
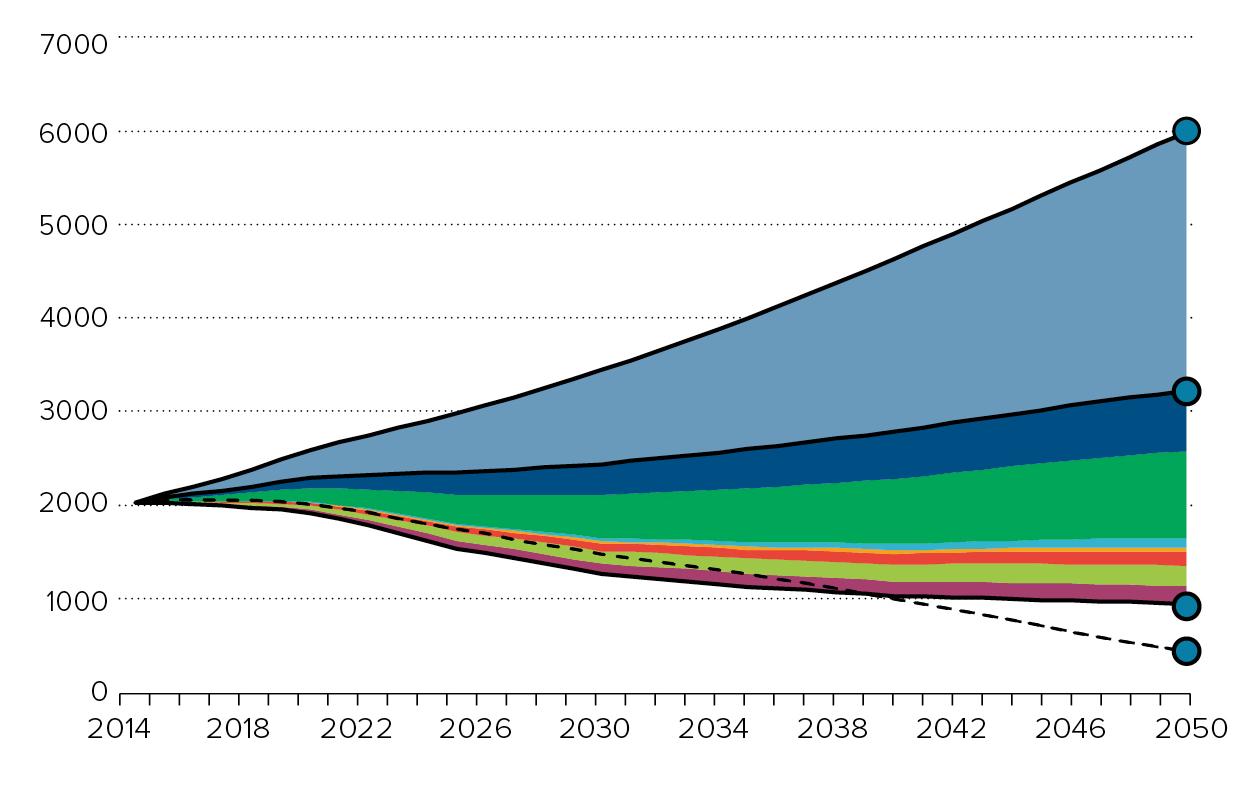
Figures 18a: Resulting reduction in health care sector emissions between 2014 and 2050 enabled though the seven high impact actions implemented across the three decarbonization pathways as discussed in Chapter 5.
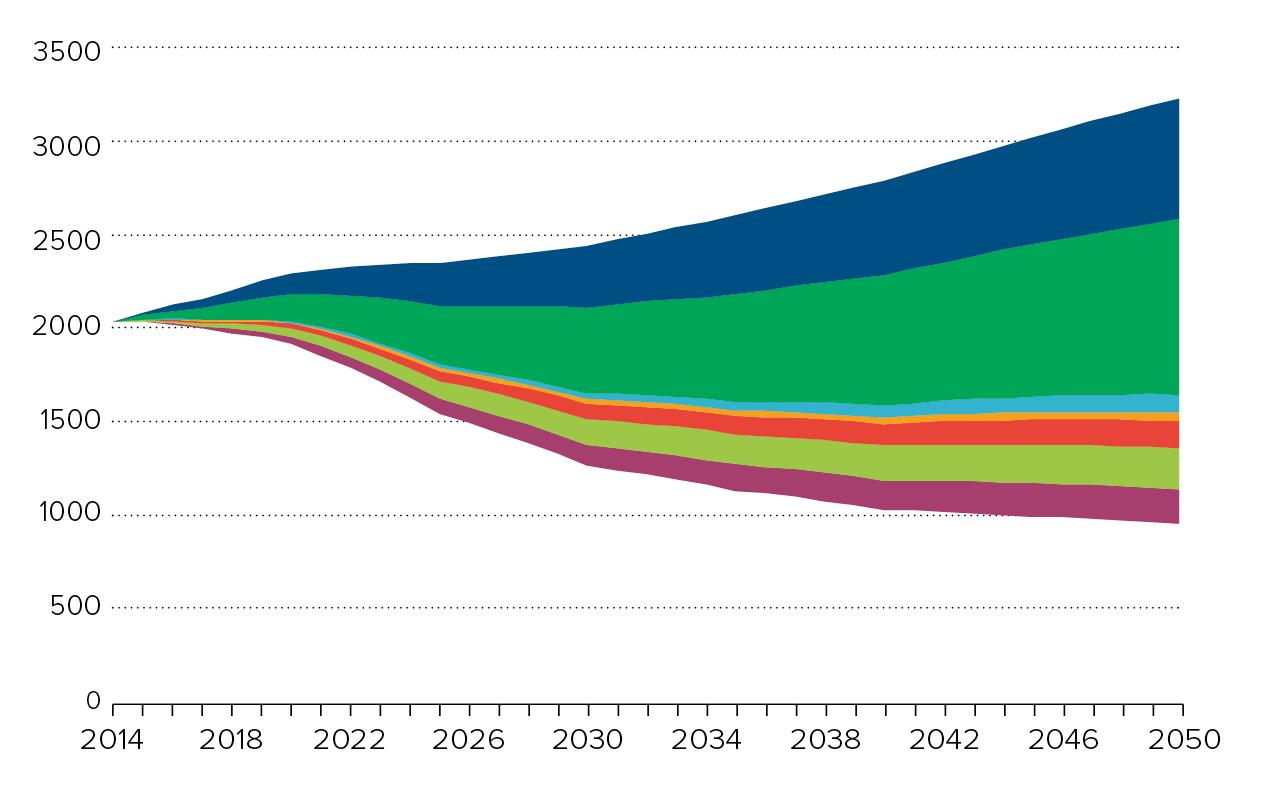
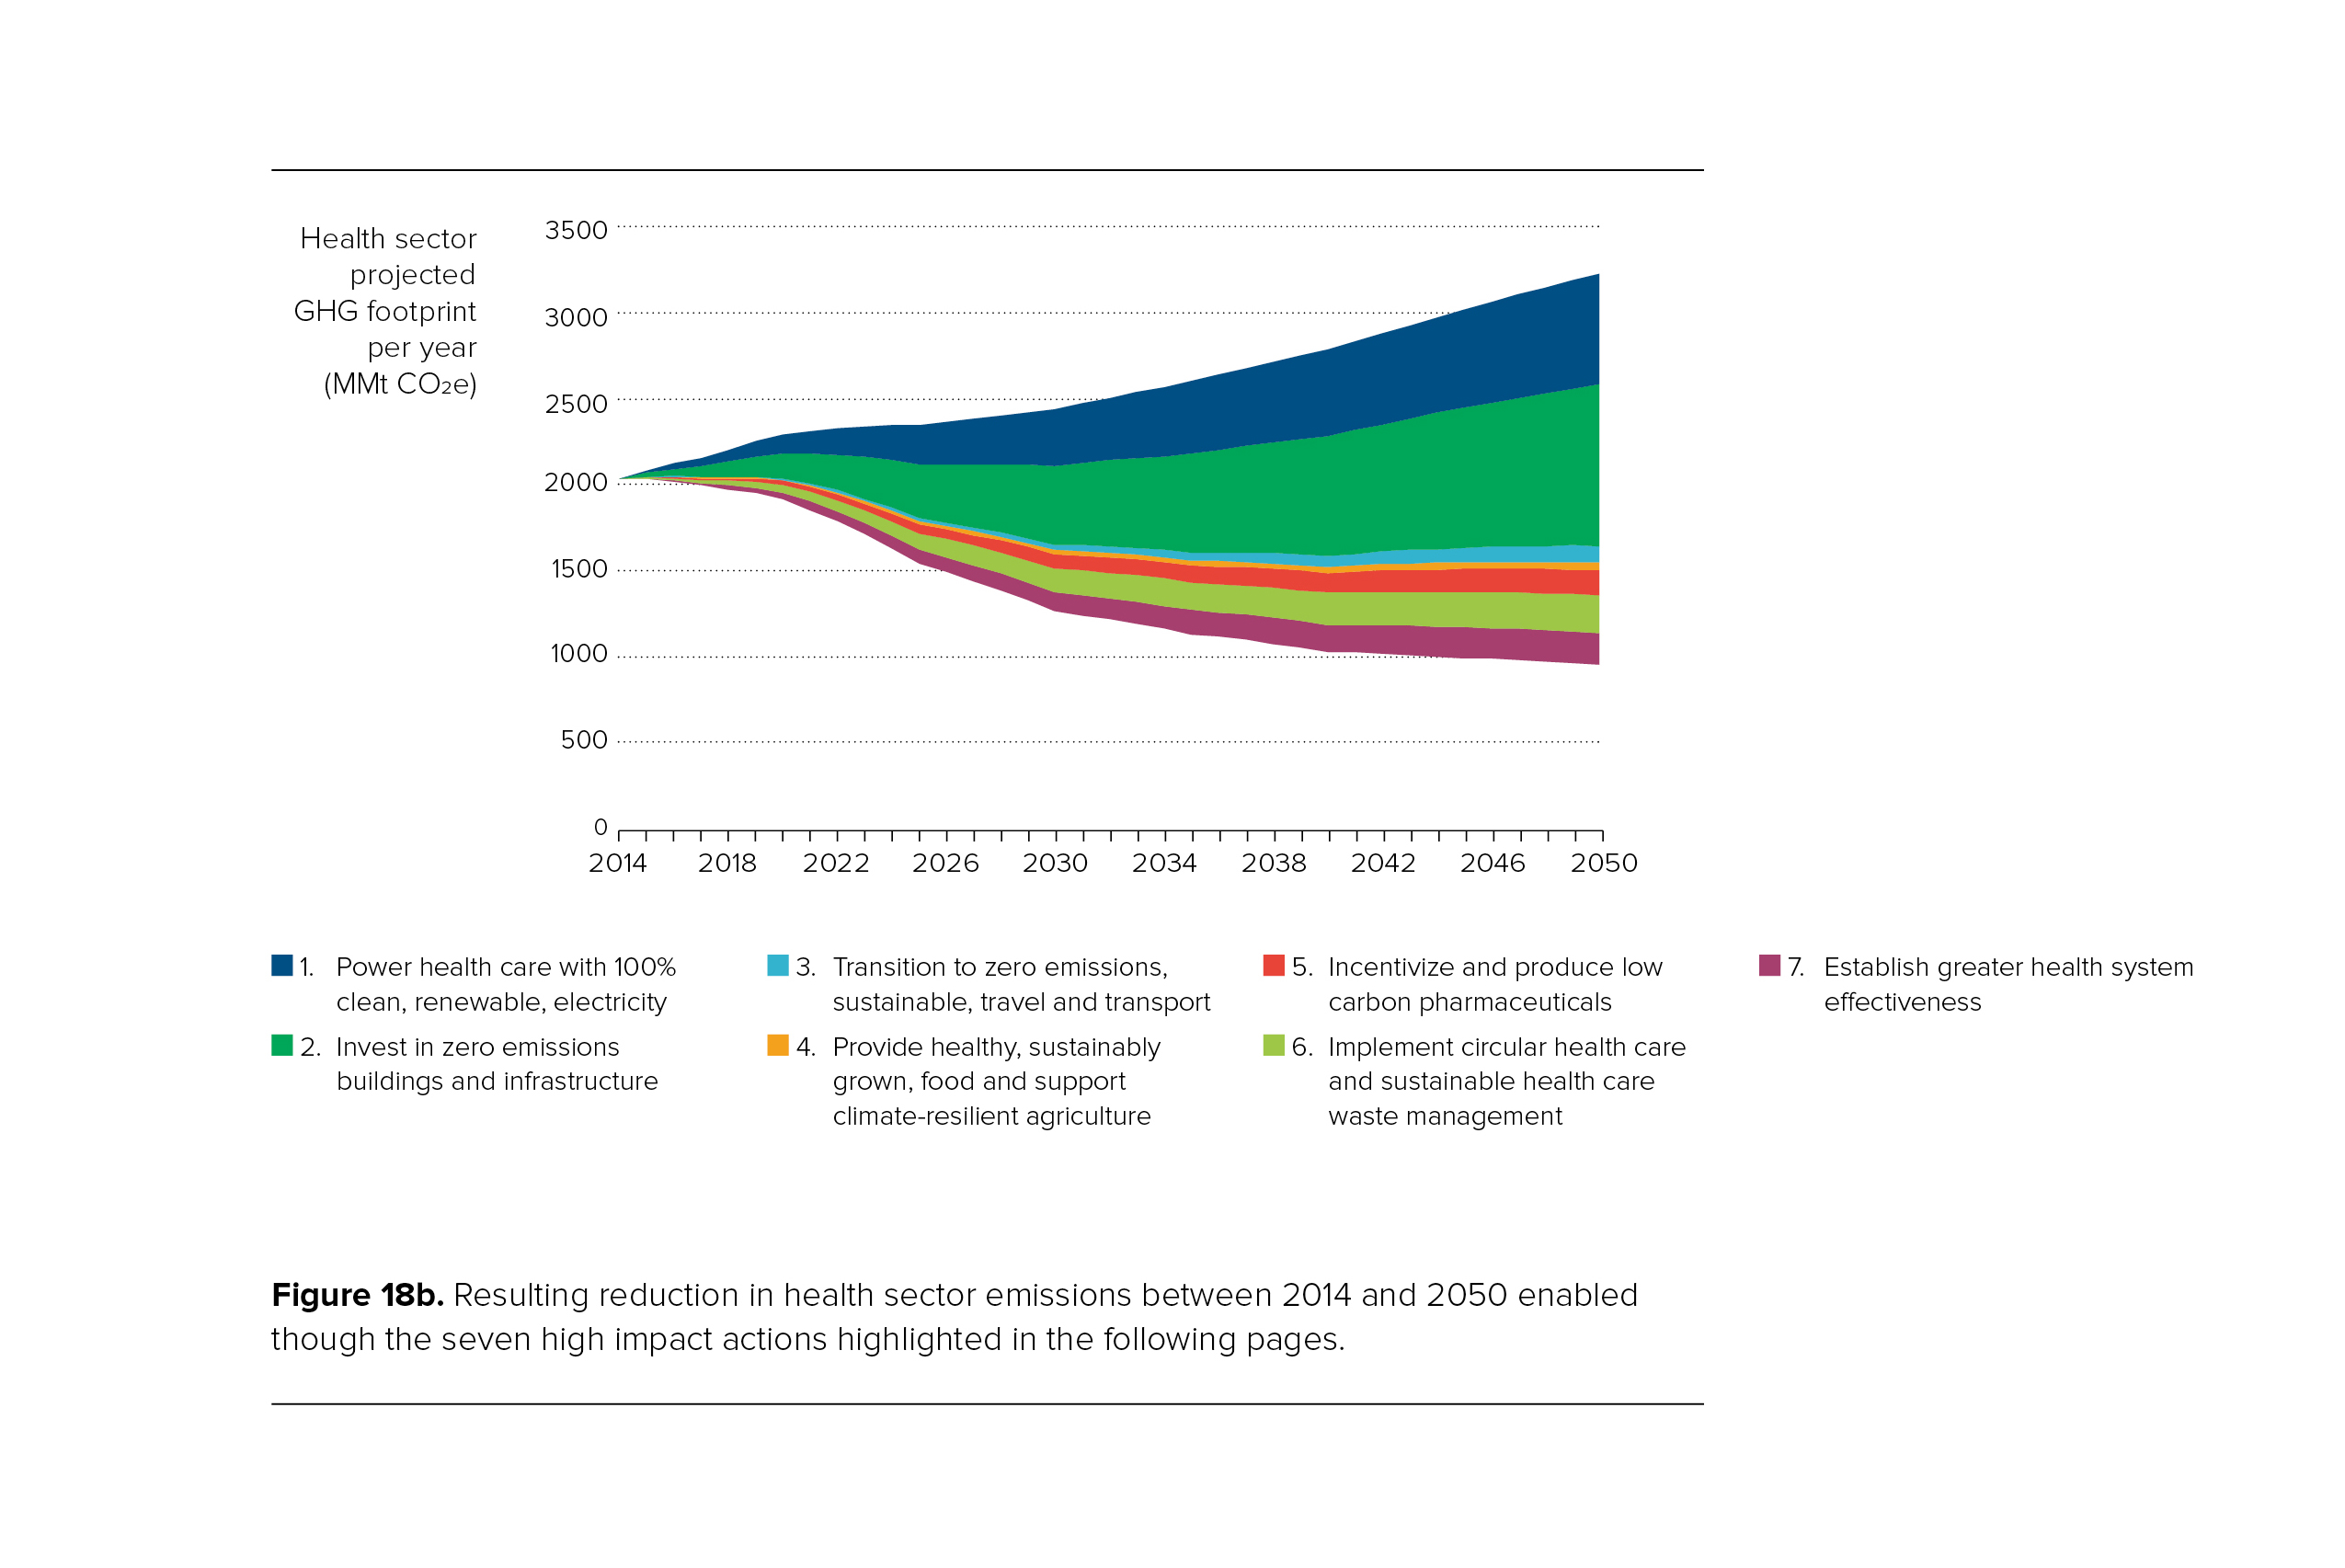
Figures 18b: Seven high impact actions for health care sector emissions reduction as discussed in Chapter 5.
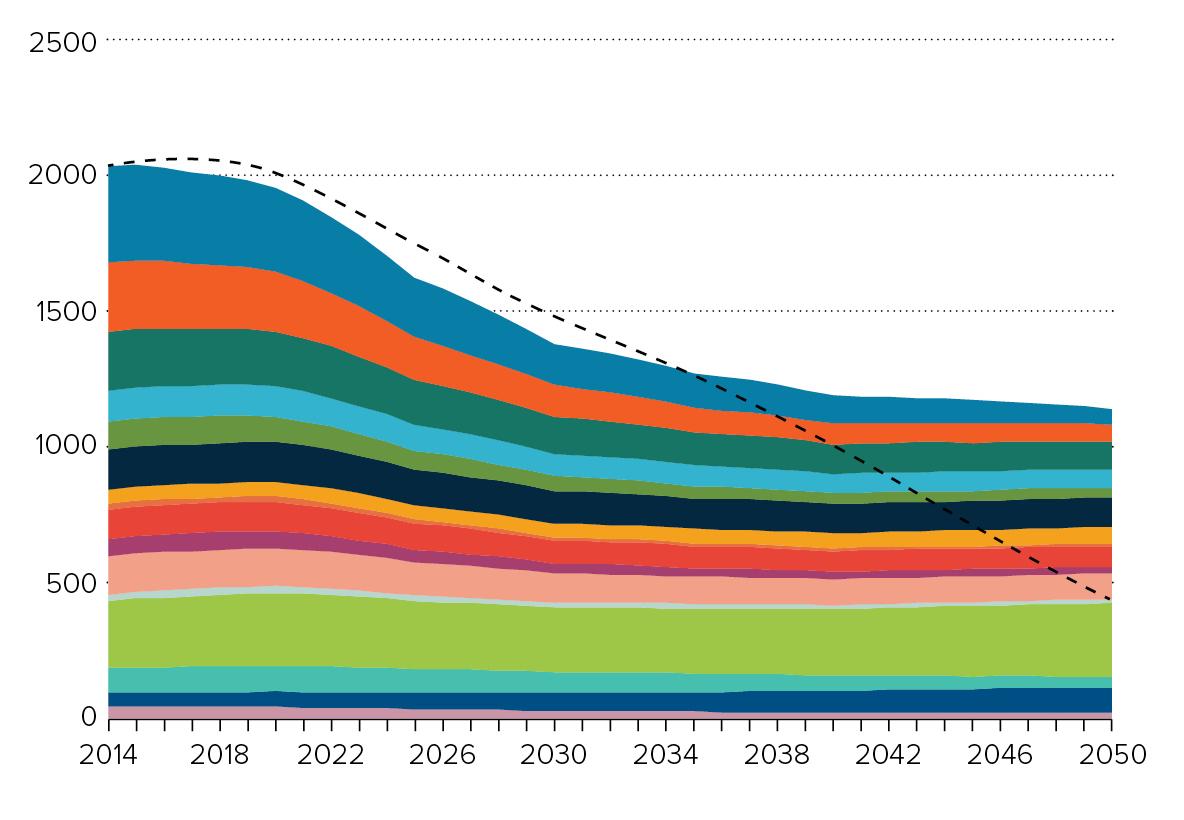
Detail of Uncharted Territory in Figure 17: Projected health care sectors emission gap to zero emissions after mitigation actions and economic decarbonization by category.
The graphics on this page are the property of Health Care Without Harm. You may freely download and copy the material for non-commercial use as long as Health Care Without Harm is credited as the source, without any right to resell or redistribute it or to compile or create derivative works there from. For any other use, permission is required. Please contact press@hcwh.org.