Climate Impact Checkup Technical FAQs
August 2023
1. General
1.1 How does Health Care Without Harm manage the private and sensitive data provided in the Climate Impact Checkup tool?
1.2 What is the carbon footprint or Greenhouse Gas (GHG) inventory?
1.3 Is there more than one standard to quantify and report GHG emissions?
1.4 Is one standard better than the other?
1.5 Where is the Climate Impact Checkup tool available?
1.6 Can monthly data be provided to the Climate Impact Checkup tool?
1.7 Is it possible to use a sample to report emissions?
1.8 Can a healthcare system use the Climate Impact Checkup tool?
1.9 In which languages is the Climate Impact Checkup tool available?
1.10 What is the source of information for each emission factor used in the tool?
1.11 Do I need to complete all data requirements of the Climate Impact Checkup Tool to have a baseline of my facility's GHG emissions?
1.12 If the scope 3 emissions of my organization are the scope 1 emissions of another organization (e.g., product producers), then is there a double counting of emissions from both organizations?
1.13 Can the base year be changed?
1.14 I have feedback for the tool. How do I proceed?
2. Profile
2.1 What information shall I complete in the profile section to start a new carbon footprint form?
2.2 Can the annual data (occupied beds, employees, etc.) be updated in the profile if a report for a given year is already submitted?
3. Mobile combustion
3.1 Should the fuels consumed by leased vehicles be considered?
3.2 Should the fuels consumed by hybrid and hydrogen vehicles (including motorbikes) be considered?
3.3 Should the electricity consumed by hybrid and electric vehicles (including motorbikes) be considered?
4. Cooling & fire suppression
4.1 The equipment containing a cooling & fire suppression gas is not available in the list of the scroll-down menu. How should it be reported?
4.2 I do not have the data of refrigerant gases used to recharge the cooling equipment and/or fire extinguishers during the reporting year. Should I complete the section by listing the equipment present in my institution anyway?
5. Purchased electricity
5.1 If the institution buys renewable energy, should it be included in this source?
5.2 If there is an on-site electricity generator, should it be included in this source?
6. Transport-related sources (business trips, patient commuting, and employee commuting)
6.1 The institution uses its ambulances to transport patients between different buildings and facilities. Is this patient commuting?
6.2 What if a third party owns the ambulances?
6.3 If people travel to the institution by walking or riding a bicycle, what option should they choose?
6.4 Which type of transport should be chosen if the data collected only accounts for an average car?
6.5 How should transport by other means, such as boats, be recorded?
6.6 How to use the sampling approach of Patient commuting?
6.7 How to avoid double counting when hospital employees practice carpooling?
6.8 How do we collect the data for patient and employee commuting?
7. Inhalers
7.1 What type of emissions are estimated under this source?
7.2 What does the field “Percentage of inhalers finally bought and not accounted for in the previous categories” stand for?
7.3 What happens if the institution does not have a central pharmacy and does not provide inhalers?
7.4 If the hospital uses inhalers internally for some treatment, how should this be reported?
7.5 How to recognize the type of inhaler (MDI or DPI)? How to identify the number of doses?
8. Extra Supply chain
8.1 In which scope of the GHG emissions inventory is the supply chain classified?
8.2 How does the tool calculate GHG emissions of the extra supply chain?
8.3 Why does the extra supply chain section require spending data instead of purchased quantities?
8.4 How accurate are the results provided by this tool section?
8.5 In which category can the user classify the medical consumables (masks, gloves, dressing, etc.)?
9. Solid waste disposal
9.1 The emissions estimated by the tool differ from the results obtained when using waste treatment national factors. Why does this happen?
1. General
1.1 How does Health Care Without Harm manage the private and sensitive data provided in the Climate Impact Checkup tool?
- The Climate Impact Checkup tool was primarily developed as part of the technical assistance offered by Health Care Without Harm to its members and partners in such a way that the obtained results are aimed at the management of the users themselves, not for publication purposes by Health Care Without Harm or exchanging with other members.
- If Health Care Without Harm elaborates a publication related to these results, the following aspects are included to protect data privacy:
1. Post only aggregated data or results,
2. If single study cases are required to be published, they count on the owner's written authorization.
For further information, please check the Health Care Without Harm privacy policy: https://noharm-uscanada.org/content/us-canada/privacy-policy
1.2 What is the carbon footprint or Greenhouse Gas (GHG) inventory?
A carbon footprint, also known as an inventory, is the list of greenhouse gas emissions per source resulting from activities, our facility's operation, or the manufacture and use of any product. The activities that produce GHG emissions are included in the carbon footprint. On the other hand, activities that do not release GHG emissions, such as power generation by renewable energy or transportation by bicycle, are not included in the carbon footprint.
The Climate Impact Checkup tool was conceived to help health care facilities to estimate their carbon footprint.
1.3 Is there more than one standard to quantify and report GHG emissions?
There are several standards for the organizational approach and other types of GHG inventories (products, projects, territories, etc.). The most used and applicable worldwide for organizations are the GHG Protocol and ISO 14064. The Climate Impact Checkup tool is based on the GHG Protocol, developed by the World Resources Institute and the World Business Council for Sustainable Development.
1.4 Is one standard better than the other?
Each standard responds to a specific context and need despite both being designed for the organizational approach. Studying different standards in a complementary way could lead to a better understanding of their use and applicability.
1.5 Where is the Climate Impact Checkup tool available?
Members of the Global Green and Healthy Hospitals (GGHH) have access to both online and downloadable spreadsheet versions of the Climate Impact Checkup tool, available in Hippocrates / Connect (a platform for GGHH members.
ATACH community of practice can access the downloadable spreadsheet, while health care and sustainability professionals who enroll in the online course receive both the downloadable spreadsheet and a limited online tool version for six months after registration.
1.6 Can monthly data be provided to the Climate Impact Checkup tool?
As a GHG inventory is developed yearly, the provided data in the tool is expected to correspond to 12 months. If data is available monthly, a health care facility or hospital can sum the month-by-month data in an independent spreadsheet using the sum formula (m1+m2+…+m12). When the whole year's data is computed, the results are entered into the tool.
1.7 Is it possible to use a sample to report emissions?
Collecting the activity data needed to estimate emissions of some sources, such as Scope 3 transport-related categories, might demand a lot of work.
To address this issue, facilities started to conduct samples. They collect the data for one week or month, then multiply the results to obtain the data corresponding to the year. For example, if a sample of a month is defined, the number of trips made during that period should be multiplied by twelve to obtain the annual total to be used in the tool.
When using a one-week or month sampling, a representative moment of the year to collect the data must be selected. Using a week or a month that, for any reason, could be out of the average parameters must be avoided. For instance, hospitals specializing in respiratory infections should avoid high-demand winter times. Or, the other way around, low-demand Christmas weeks - if that applies. Each institution designs its sampling process.
See question 6.6 for more information on the sampling approach of Patient commuting.
1.8 Can a healthcare system use the Climate Impact Checkup tool?
So far, the online tool collects information at the facility level. Global Green and Healthy Hospitals members can create a system account and report for each facility belonging to it, but there will not be an automatic summation of all sub-accounts. However, for the offline Excel version of the Climate Impact Checkup tool, a supplementary tool is available that does aggregate the facility-level results. The possibility of aggregation might also be incorporated in the future in the online version.
1.9 In which languages is the Climate Impact Checkup tool available?
The online version is available in English and Spanish. The Excel version is available in English and Spanish and will soon be available in Bahasa Indonesia and Traditional Mandarin.
1.10 What is the source of information for each emission factor used in the tool?
The tool contains emission factors per country when available and applicable. For instance, national and subnational values of more than 200 nations and territories are used in electricity. At the end of this page find the list of references from where emission factors were taken.
1.11 Do I need to complete all data requirements of the Climate Impact Checkup Tool to have a baseline of my facility's GHG emissions?
Completing all the data requirements to have a baseline is not mandatory, even though it is recommended. The institution might only report some sources for various reasons. So, the first step in each category is to select the treatment each source will receive using the following notation keys:
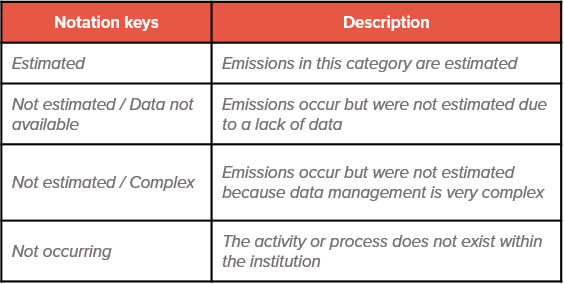
When selecting "Not estimated" or "Not occurring," it is encouraged to provide additional information in the “Comments” tab available to add clarifications. For "Not estimated" sources, it is expected for the institution to find a way to start reporting them in the following years.
1.12 If the scope 3 emissions of my organization are the scope 1 emissions of another organization (e.g., product producers), then is there a double counting of emissions from both organizations?
The scope 3 emissions of an organization is usually the direct emission of another organization. But each organization would have a different and often mutually exclusive opportunity to reduce emissions. Therefore, the Greenhouse Gas Protocol states, "By allowing for GHG accounting of direct and indirect emissions by multiple companies in a value chain, scope 1, scope 2, and scope 3 accounting facilitates the simultaneous action of multiple entities to reduce emissions throughout society".
1.13 Can the base year be changed?
The base year will change whenever the inventory establishes new emission sources or has other changes, for example, expansion of its building area (m2).
1.14 I have feedback for the tool. How do I proceed?
We are continuously striving to perfect our tool and would appreciate your valuable inputs. You can reach out to us at checkup@hcwh.org.
2. Profile
2.1 What information shall I complete in the profile section to start a new carbon footprint form?
When using the tool, start by completing the profile information placed in the Hippocrates data center in Connect. Many institutions will have already completed this section, while this will be their first time entering data for others. No matter the case for your institution, some data should be updated annually.
This section requests general data on the institution and its context, such as name, city, years in service, sub-national region (only for countries where the electricity grid varies between regions), hours of operation, type of institution, and weather conditions (temperature and humidity). This information provides a description of the institution and helps with estimations (for example, temperature affects the decomposition of waste in final disposal sites).
- Occupied beds (annual average): This parameter refers to the hospital's number of inpatient beds. However, if the hospital normally operates under capacity, indicate the average quantity occupied. For example, if a facility with 500 available beds in 2019 had an 85% annual occupancy rate, it would have 425 occupied beds in 2019. The facility might not have any inpatient beds; in this case, indicate 0 (zero).
- Full-time equivalent employees (FTE): This parameter allows facilities to sum up and compare part-time and full-time employees by converting the hours worked by several part-time employees into hours worked by full-time employees. For example, consider 40 hours a week full-time. If a facility has three employees who work 40 hours and another three working 20 hours, converted to FTE, there are 4.5 employees.
- Patients (annual total): This parameter includes all patients (both inpatient and outpatient) who come to the institution each year for medical consultations, laboratory and imaging studies, surgical interventions, and other reasons.
- Building covered area (m2): This parameter is the total built surface of the facility, without considering its green or free spaces and taking into account all its floors and buildings. For example, if a hospital has eight floors of 1000 m2 each, the Building covered area will be 8000 m2. And, if an institution has two buildings, one of 3,500 m2 and another of 450 m2, the building covered area will be 3,950 m2.
2.2 Can the annual data (occupied beds, employees, etc.) be updated in the profile if a report for a given year is already submitted?
Yes, it is possible to update the annual data. However, for the system to take into account this new data, the user also has to re-submit the Climate Impact Checkup form for the corresponding year (to do this, find the report in the "Archive" section, go to "View Submission", click on "Edit", and then on "Submit").
3. Mobile combustion
3.1 Should the fuels consumed by leased vehicles be considered?
Only include leased vehicles if the institution is responsible for buying the fuel or can select its type and model (and therefore can make decisions about fuel consumption). Otherwise, only include vehicles that the institution owns.
3.2 Should the fuels consumed by hybrid and hydrogen vehicles (including motorbikes) be considered?
Yes, the fuel (not the electricity) consumed by hybrid and hydrogen vehicles and motorbikes should be included under Mobile combustion.
3.3 Should the electricity consumed by hybrid and electric vehicles (including motorbikes) be considered?
Fully electric or hydrogen vehicles, as well as motorbikes, are not reported under Mobile combustion. They will only be registered under Scope 2 if the vehicle is recharged in the institution. If it is recharged elsewhere, the emissions associated with the electricity consumption are not accounted for.
For more information about emissions from business trips, patient commuting, and employee commuting, see section 4 - Transport-related sources.
4. Cooling & fire suppression
4.1 The equipment containing a cooling & fire suppression gas is not available in the list of the scroll-down menu. How should it be reported?
When some types of equipment are not specifically available, choose the closest option to report their emissions. Clarify this in the comments section for your colleagues to use the same criteria in future reports.
4.2 I do not have the data of refrigerant gases used to recharge the cooling equipment and/or fire extinguishers during the reporting year. Should I complete the section by listing the equipment present in my institution anyway?
If you do not have data of refrigerant gases used to recharge the cooling equipment and fire extinguishers, choose “Not estimated” in the Notation Keys. Do not list the equipment and the gas they use because the tool will ask you for the amount of gases or will assume you recharged all the listed devices, overestimating your carbon footprint.
5. Purchased electricity
5.1 If the institution buys renewable energy, should it be included in this source?
Renewable energy is not included in the estimation as it does not produce GHG emissions during its operation (see question 1.2 for more information). Only the electricity bought from the utility and not covered by a renewable energy purchase agreement should be included in this source.
The Climate Impact Checkup tool uses national and subnational grid emission factors for more than 200 nations and territories. At the end of this page find the list of references from where emission factors were taken.
5.2 If there is an on-site electricity generator, should it be included in this source?
No. If the generator uses any fuel to run, the amount consumed should be included under stationary combustion. It shouldn't be reported anywhere in this tool if it is a renewable energy generator (such as solar photovoltaics).
6. Transport-related sources (business trips, patient commuting, and employee commuting)
6.1 The institution uses its ambulances to transport patients between different buildings and facilities. Is this patient commuting?
No. When the institution owns the ambulances used to transport patients, that should be included in scope 1/mobile combustion. Patient commuting should be used when patients arrange their own transportation (through public transport or their own vehicles). These are considered scope 3 - indirect - emissions, as the institution has limited influence to manage and reduce them.
6.2 What if a third party owns the ambulances?
If the ambulances are owned by a third party or a third party pays and controls the fuel, the institution can include this calculation in scope 3/patient commuting. Select one of the private truck or SUV categories for the type of transport depending on the fuel the ambulances use. While a private truck or SUV is not precisely an ambulance, in terms of combustion, they use similar technology. Remember that the number of trips considered in patient commuting must correspond to the period (week, month, or year) chosen for the sample. Do not multiply the number of trips to make the data annual because the tool will do it automatically, depending on the sample period selected.
6.3 If people travel to the institution by walking or riding a bicycle, what option should they choose?
Walking and riding a bicycle are not included as transport options, as these activities do not release GHG emissions. See question 1.2 for more information.
6.4 Which type of transport should be chosen if the data collected only accounts for an average car?
If you don't know the fuel, choose diesel. If you don't know the type of vehicle, choose the car. Clarify this in the comments section and consider it an improvement opportunity for future reports.
6.5 How should transport by other means, such as boats, be recorded?
Some very particular forms of transportation, such as water means of transport, are not currently included in the tool.
However, when some types of transport are not specifically available, an alternative to report their emissions is to choose the closest option. For instance, motorbikes can be selected in the case of tricycles (not available in the tool). Clarify this in the comments section for your colleagues to use the same criteria in future reports.
6.6 How to use the sampling approach of Patient commuting?
Patient commuting requires a lot of work, as many patients visit the facility yearly. Therefore, a sampling approach is proposed in the Climate Impact Checkup tool. Instead of collecting the whole year's data, a sample of a week or month could be used (by selecting it from the multiple choice question).
The data will correspond to this period. If a 7-day period is chosen, the information about the commutes taking place during a week must be entered. Once the form is submitted, the tool will make the needed calculations to convert this value from the sampling period to the annual equivalence.
When using a one-week or month sampling, a representative moment of the year to collect the data must be selected. Using a week or a month that, for any reason, could be out of the average parameters must be avoided. For instance, hospitals specializing in respiratory infections should avoid high-demand winter times. Or, the other way around, low-demand Christmas weeks - if that applies. Each institution designs its sampling process.
6.7 How to avoid double counting when hospital employees practice carpooling?
The unit of the emission factors of private vehicles (such as private car (diesel), private car (gasoline), SUV or Light Goods Vehicle (diesel), SUV or Light Goods Vehicle (gasoline), and Motorbike) is gGHG/km. In these cases, emissions are estimated per vehicle, no matter how many passengers use it. Because of this, if employees share a car, van, or motorcycle ride, the carpool ride needs to be entered only once instead of per passenger.
6.8 How do we collect the data for patient and employee commuting
Individually collecting and systematizing the information for these sources might take a lot of work. One alternative to make this task easier is to use an online service to create and share surveys (such as Google Docs forms or Survey Monkey). When doing this, include a question for each type of data requested. And in the scroll-down menus or multiple-choice questions, remember to offer the same options presented by the tool; otherwise, answers not available in the tool might appear. Distribute the survey by sharing the link with all members of the hospital or patients, setting a deadline for submissions, and explaining the reason behind the request so they feel encouraged to complete it.
7. Inhalers
7.1 What type of emissions are estimated under this source?
Emissions in this category result from the manufacture and use of inhalers. However, the main cause is the propellant they contain and release when used or when final treatment and disposal are not carried out correctly. For more information, see the reference documents used to elaborate this section:
- National Institute for Health and Care Excellence | Patient decision aid: Inhalers for asthma
- United Nations Environmental Programme | Montreal Protocol on substances that deplete the ozone layer | 2014 Report of the Medical Technical Options Committee
7.2 What does the field “Percentage of inhalers finally bought and not accounted for in the previous categories” stand for?
For prescribed inhalers, it is expected that the quantity of inhalers that patients finally buy will be smaller than the prescribed by doctors. In addition, if the institution has a pharmacy, there will be an overlap between two lending categories ("Sold in the central pharmacy" and "Prescribed by doctors"), as patients probably buy the prescribed inhalers in the central pharmacy. To take these situations into account, the approximate percentage of prescribed inhalers that are actually purchased outside the health care facility should be entered. 60% is suggested as the default value, but it can be modified to reflect the institution context better.
7.3 What happens if the institution does not have a central pharmacy and does not provide inhalers?
Only the lending category “Prescribed by doctors” should be completed in this case. In addition, the field “Percentage of inhalers finally bought and not accounted for in the previous categories” should be 100%, as the only possibility for patients to get the inhalers is by buying them outside the institution.
7.4 If the hospital uses inhalers internally for some treatment, how should this be reported?
The inhalers used in internal treatments in the hospital must be reported in "Delivered by the hospital".
7.5 How to recognize the type of inhaler (MDI or DPI)? How to identify the number of doses?
Factsheets will provide the answer when it is unclear whether it is an MDI or DPI. If you find it contains a propellant, it is an MDI. In addition, you can find the number of doses in the factsheet, but be careful to avoid mistaking the grams for them.
8. Extra Supply chain
8.1 In which scope of the GHG emissions inventory is the supply chain classified?
It is commonly classified in scope 3. Third parties provide these goods and services, and their control in production, operation, and transportation does not depend directly on the health care facility but on the provider (see each spending category and at the end of this page its description in Annex 1).
8.2 How does the tool calculate GHG emissions of the extra supply chain?
The tool takes the data provided by the user and calculates the GHG emissions using the Emission Factors Methodology by carbon intensity given in CO2e/US dollars. These emission factors are taken from WIOD (World Input-Output Database). For more information, see the Global Road Map for Health Care Decarbonization (Annex A).
8.3 Why does the extra supply chain section require spending data instead of purchased quantities?
As in the supply chain, the procurement of goods and services consists of various categories, implying the use of many different units (mass, volume, length, etc.), making calculating GHG emissions more complicated. For example, Food and Catering implies the purchase of hundreds of different products for which emission factors are not available for every country at the moment. Therefore, a single unit standardizes the calculation to make it simpler and more consistent.
The chosen single unit is US dollars (currency) since it is a procurement process and because the Emissions Factors to calculate GHG emissions from the supply chain are available in CO2e/US dollars (carbon intensity).
8.4 How accurate are the results provided by this tool section?
This section of the tool is designed to be an estimate to provide an order of magnitude of the product categories which represent carbon hotspots within your supply chain. The information received will rank order the product categories that are the most carbon intensive to identify the suppliers to engage with to reduce the emissions in their production and transportation process.
Regarding the accuracy of the results, it is essential to consider the following facts:
- The results provided by the tool are a helpful starting reference for the health care facility’s decision-making in sustainable procurement and decarbonization.
- Given all the variables that can influence the process, it is normal to have a level of uncertainty in this type of calculation.
- The first source of uncertainty (lack of precision) of the result is the data provided by the user, in such a way that the user needs to make sure that the data provided is as accurate as possible according to the documentary evidence (invoices, receipts, spending or purchases reports, etc.).
- The result's second source of uncertainty (lack of precision) is the Emission Factors applied to the calculation. In this case, these Emission Factors must be taken from the most reliable and official sources of information as far as possible; however, they are challenging to find for supply chain categories for a specific sector for every country. The Emission Factors used for the Climate Impact Checkup tool are taken from WIOD (World Input-Output Database) from the Global Value Chain Research Area of Groningen University (Netherlands).
- It is rare to find GHG calculation tools that include a supply chain section, as scope 3 emissions have been mostly optional to calculate and more complex to manage.
8.5 In which category can the user classify the medical consumables (masks, gloves, dressing, etc.)?
According to the description of "Other manufactured products" category, these Personal Protective Equipment (PPE) can be included in such category, as its description indicates the following subcategories: Manufacture of textiles, wearing apparel and leather products and manufacture of rubber and plastic products.
9. Solid waste disposal
9.1 The emissions estimated by the tool differ from the results obtained when using waste treatment national factors. Why does this happen?
The emissions of this category depend on several parameters, such as the composition of the solid waste and weather conditions over time at the disposal site. By combining these data, it is possible to forecast the quantity of methane to be released into the atmosphere due to the decomposition of the waste (in general, higher organic composition or higher average atmosphere temperatures result in higher methane production). As a forecasting process that uses simplified assumptions is involved, this estimation may differ from others with national emission factors.
Grouped sectors (categories), definition, and WIOD subcategories for the Extra Supply Chain estimation.